C18 NC-TNP
DC60537
Recommended because it shares a closely related research category or delivery context. Formulation and performance are product- and study-specific.
View product →
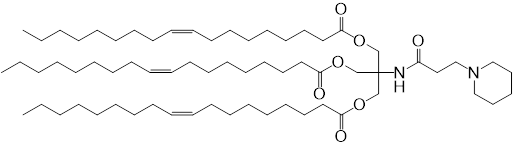
TOT-5 is a tri-oleoyl-Tris ionizable lipid investigated for spleen-directed mRNA delivery. Suzuki et al. showed that phospholipid composition influenced liver-versus-spleen expression and uptake by splenic B cells. The study includes reporter expression, model-antigen immune responses and comparative mouse tolerability data.
Open full Formulation & Performance →
Product-specific evidence from the 2025 Journal of Controlled Release paper and its supporting information. Particle properties, delivery and tolerability remain tied to their individual formulations and experiments.
TOT-5 is explicitly depicted in Figure 1 and identified in the supporting information. The catalog structure corresponds to C66H120N2O7, with a calculated average molecular weight of 1053.693. Apparent pKa 6.2 was measured in LNPs, rather than every possible preparation.
| Component | DC Chemicals product | Molecular weight | Molar ratio | Mass at 1 µmol total lipid (mg) |
|---|---|---|---|---|
| TOT-5 | DC60821 | 1053.693 | 65 | 0.674779 |
| DSPC | DC57005 | 790.15 | 15 | 0.116771 |
| Cholesterol | DCD-041 | 386.65 | 20 | 0.076187 |
| DMG-PEG2000 | DC40169 | 2507 | 1.5 | 0.037049 |
The source labels 65:15:20:1.5 as mol%, although these entries sum to 101.5. Here they are reproduced as relative molar parts; calculated masses normalize by 101.5 and are not an author-reported correction. The study calls this formulation 15%DSPC. Its 3%DSPC comparator is 65:3:32:1.5. DMG-PEG2000 uses the DC Chemicals nominal average molecular weight 2507.
Prefilled proportions follow the source specified above. Molecular weights and ratios are editable. Results are calculated, not measured study data. No N/P or RNA dose is inferred.
| Component | MW | Molar ratio | Mass (mg) | Mass % |
|---|---|---|---|---|
| TOT-5 | ||||
| DSPC | ||||
| Cholesterol | ||||
| DMG-PEG2000 |
| Study group | Source composition or property | Interpretation |
|---|---|---|
| 15%DSPC | TOT-5 / DSPC / cholesterol / DMG-PEG: 65:15:20:1.5 | Relative numbers total 101.5; spleen-directed study formulation |
| 3%DSPC | 65:3:32:1.5 | Lower-DSPC comparator with greater liver expression |
| Apparent pKa | 6.2 in both DSPC groups in Table S5 | Formulated-LNP measurement; other properties differ between batches |
| Production approach | Microfluidic mixing and subsequent buffer exchange | Methods §2.4; not a validated manufacturing instruction |
| Scope | The same lipid produced different tissue-expression profiles | Organ selectivity cannot be assigned to the isolated lipid alone |
Main §§2.4,3.2 and Figure 2; SI Table S5. Calculations use relative molar parts.
| DSPC label | Z-average size (nm) | Number-mean size (nm) | PDI | Zeta potential (mV) | RNA encapsulation (%) |
|---|---|---|---|---|---|
| 3% | 128 ± 20 | 93 ± 23 | 0.10 ± 0.05 | +2.6 ± 1.4 | 85.3 ± 6.3 |
| 5% | 118 ± 2.3 | 92 ± 10 | 0.08 ± 0.06 | +1.8 ± 1.0 | 89.1 ± 6.5 |
| 10% | 113 ± 15 | 83 ± 13 | 0.09 ± 0.06 | +3.4 ± 0.4 | 91.4 ± 4.6 |
| 15% | 109 ± 8 | 80 ± 12 | 0.11 ± 0.08 | +1.8 ± 1.5 | 90.3 ± 7.0 |
| 20% | 111 ± 16 | 84 ± 12 | 0.07 ± 0.06 | +2.1 ± 1.2 | 91.5 ± 5.0 |
SI Table S4, TOT-5 rows. Table S5 is a separate characterization series. Z-average and number-mean sizes are different statistics.
| Experiment | Model / endpoint | Reported result | Boundary |
|---|---|---|---|
| Organ expression | Mouse IV Fluc-mRNA; liver and spleen at 6 h; n=3 | Increasing DSPC shifted expression toward spleen | Figure 2a; no universal fold advantage inferred |
| ApoE dependence | Wild-type versus ApoE-deficient mouse reporter expression | 3%DSPC liver expression depended on ApoE; no corresponding dependence for 15%DSPC | Figure 3b; model-specific result |
| B-cell expression | Isolated splenic B cells at 6 h; RLU per 10^7 cells; n=3 | Supports functional RNA delivery in addition to uptake | SI Figure S7; distinct from whole-organ expression |
| Immune-cell uptake | Fluorescent carrier tracking | B-cell uptake increased with DSPC; macrophages and DCs also took up particles | Figure 3c; carrier uptake is not protein expression |
| Marginal-zone localization | Microscopy and flow cytometry | Preferential accumulation in marginal-zone B cells | Figure 4d–e; not exclusive targeting |
Main §§2.6,3.2–3.4 and Figures 2–4; SI Figure S7. Whole-organ and isolated-cell assays used different exposure conditions.
| Question | Observation | Interpretation |
|---|---|---|
| Helper-lipid identity | Saturated DSPC/DPPC differed from unsaturated POPC/DOPC | Substitutions are not evidence-equivalent |
| Protein corona | Less ApoE and more complement-associated proteins with 15%DSPC | Supports a mechanism, not human biodistribution |
| Receptor involvement | Anti-CD21/35 reduced B-cell uptake of 15%DSPC | Figure 4c; no exact 60% inhibition claim retained |
| Morphology | No major macroscopic cryoTEM difference between 3%DSPC and 15%DSPC | Figure 2b; morphology did not explain selectivity |
Main §§3.2–3.4, Figures 2b,3d and4. Serum versus plasma affected corona composition.
| Endpoint | Study context | Reported result | Source |
|---|---|---|---|
| Reporter distribution | Mouse IM Fluc-mRNA, 6 h; n=8 | Reduced liver expression with 15%DSPC, retaining injection-site and splenic expression | Figure 5a |
| Antigen-specific IgG | OVA-mRNA immunization; serum dilution; n=3 | Both TOT-5 formulations gave IgG responses comparable to the tested SM-102 formulation | Figure 5b; not clinical protection |
| Antigen-specific CD8+ cells | Splenic OVA-tetramer-positive fraction; n=8 | 15%DSPC increased the antigen-specific fraction | Figure 5c; no exact 3.5% claim retained |
| Comparison scope | Laboratory LNP comparators using named lipids | Not a head-to-head clinical comparison with marketed vaccines | Methods and Figure 5 |
Main §§2.12–2.14,3.5 and Figure 5. OVA was a model antigen.
| Endpoint | 15%DSPC TOT-5 | Comparator / limitation |
|---|---|---|
| ALT and AST | No significant increase reported in this immunization model | 3%DSPC increased ALT; SM groups increased enzymes; Figure 5d |
| Liver necrosis | 0/4 positive | 3%DSPC:1/4 very slight; SM:2/4 very slight; Table1 |
| Kupffer-cell enlargement | 0/4 positive | 3%DSPC:4/4 very slight; SM:1 moderate and3 very slight; Table1 |
| Splenic extramedullary hematopoiesis | 4/4 positive:2 intermediate,2 very slight | PBS:0/4; does not support a blanket no-pathology claim |
| Inflammatory markers | Lower TNF-alpha, IFN-gamma and CXCL10 than SM | SI Figure S15,4 h,n=3; inflammation was not universally absent |
| Scope | Limited mouse groups and observation windows | No human safety margin or chronic toxicology established |
Main Table1 and Figure5d; SI Figures S13–S15. Histology 7 days after the second administration. Source grading:−absent,±very slight,+moderate,++intermediate,+++high.
| Parameter | PBS | 15%DSPC | 3%DSPC | SM |
|---|---|---|---|---|
| BUN (mg/dL) | 16.8 ± 0.5 | 20.8 ± 2.2 | 19.3 ± 3.0 | 24.6 ± 3.0 |
| Creatinine (mg/dL) | 0.1 ± 0.01 | 0.2 ± 0.02 | 0.1 ± 0.01 | 0.1 ± 0.01 |
| LDH (IU/L) | 347.5 ± 76.9 | 344.0 ± 225.5 | 615.0 ± 48.6 | 362.0 ± 104.8 |
| Glucose (mg/dL) | 225.5 ± 30.2 | 214.5 ± 38.4 | 224.5 ± 5.4 | 166.5 ± 17.9* |
Main Table2, mean±SD,n=4; *p<0.05 versus PBS, Dunnett comparison. Research results are not product release specifications.
Figures 2–5: tissue expression, splenic uptake, receptor dependence and tolerability — Original source figures.
| CAS No. | Not available |
| Chemical Name | Lipid TOT-5 |
| Synonyms | Lipid TOT 5,TOT5 |
| SMILES | CCCCCCCC/C=C\CCCCCCCC(=O)OCC(COC(=O)CCCCCCC/C=C\CCCCCCCC)(COC(=O)CCCCCCC/C=C\CCCCCCCC)NC(=O)CCN1CCCCC1 |
| Formula | C66H120N2O7 |
| M.Wt | 1053.693 |
| Purity | >95% by ELSD-HPLC |
| Storage | Pure form: −20 °C, 1 year; In solvent: −80 °C, 6 months; −20 °C, 1 month. Sealed and protected from light. |
| Shipping condition | Ships from Shanghai. Pure lipid is stable during ice-pack transport. |
| Publication |
The product molecular weight is prefilled when available and remains editable. Confirm solvent compatibility and solubility before preparation.
Solvent volumes update from the molecular weight above.
| Mass | 1 mM | 5 mM | 10 mM |
|---|---|---|---|
| 10 mg | 9.4904 mL | 1.8981 mL | 0.9490 mL |
| 25 mg | 23.7261 mL | 4.7452 mL | 2.3726 mL |
| 50 mg | 47.4522 mL | 9.4904 mL | 4.7452 mL |
| 100 mg | 94.9043 mL | 18.9809 mL | 9.4904 mL |
| 250 mg | 237.2608 mL | 47.4522 mL | 23.7261 mL |
Contact our team with the catalog number and requested quantity.