SM-102
DC52025
Recommended because it shares a closely related research category or delivery context. Formulation and performance are product- and study-specific.
View product →

ALC-0315 is an ionisable aminolipid that used for mRNA compaction and aids mRNA cellular delivery. ALC-0315 can be used to form lipid nanoparticle (LNP) delivery vehicles.
DC Chemicals can supply ALC-0315 (DC42537) as a GMP-grade ionizable lipid material for customer toxicology programs and clinical-stage formulation development. Kg-scale production capability is available for qualified projects, subject to technical review, batch planning, quality agreement and batch-specific release requirements.
Available with batch-specific identity, purity, residual-solvent, water, elemental-impurity, endotoxin and bioburden testing. Quality documentation can be aligned with the customer's qualification package.
Suitable as a lipid raw material for customer-led toxicology studies and clinical-stage formulation development. Final suitability remains subject to the customer's formulation, QA and regulatory assessment.
Production can be planned from research quantities through kilogram scale, with project-specific lead time, batch size, analytical release testing and packaging arranged in advance.
Issued COA: Lot C09601-N250501; manufacture date 14 May 2025; retest date 13 May 2028. Refer to the issued certificate for batch-specific quality results.
COA & quality informationQuality and regulatory note: “GMP-grade” describes the grade of the supplied lipid material and its supporting quality documentation. It does not mean that this lipid itself is an approved drug substance or regulatory-authorized clinical material. Customers remain responsible for qualification, formulation, sterility strategy, release criteria and regulatory use.
| CAS No. | 2036272-55-4 |
| Chemical Name | ALC-0315 |
| Synonyms | ALC-0315;ALC 0315;ALC0315 |
| SMILES | OCCCCN(CCCCCCOC(C(CCCCCC)CCCCCCCC)=O)CCCCCCOC(C(CCCCCC)CCCCCCCC)=O |
| Formula | C48H95NO5 |
| M.Wt | 766.27 |
| Purity | >95% by ELSD-HPLC |
| Storage | Pure form: −20 °C, 1 year; In solvent: −80 °C, 6 months; −20 °C, 1 month. Sealed and protected from light. |
| Shipping condition | Ships from Shanghai. Pure lipid is stable during ice-pack transport. |
| Publication | Zhang L, et al. Effect of mRNA-LNP components of two globally-marketed COVID-19 vaccines on efficacy and stability. npj Vaccines. 2023;8:156. |
Study-specific compositions, preparation conditions and experimental outcomes for ALC-0315.
Complete primary article, six-page Supplementary Figures and reporting summary recovered. This guide covers the matched experimental lipid comparison, short freezing test and 20-week formulated-particle storage study. The study formulations are distinct from marketed vaccine formulations.
Reported composition and calculated mass are separate. Molecular-weight inputs use catalog values or an explicitly identified reference average; DMG-PEG2000 uses 2507. Edit inputs only when using a verified alternative material.
Molar composition; N/P = 4. The same helper lipids and ratios were used for all three ionizable-lipid comparators. PBS with or without 10% sucrose (w/v) was evaluated as a separate storage/excipient condition.Main Methods: mRNA-LNP production; Fig. 1b; Lipids materials subsection
| Component | Molecular weight | Molar parts | Normalized mol% | Amount (µmol) | Weight (mg) |
|---|---|---|---|---|---|
| ALC-0315 | 50.000 | 76.7566 | 58.8163 | ||
| DSPC | 10.000 | 15.3513 | 12.1298 | ||
| Cholesterol | 38.500 | 59.1026 | 22.8520 | ||
| 14:0 PEG2000 PE | 1.500 | 2.3027 | 6.2019 |
Calculated total: 100.0000 mg lipid. RNA, solvent and process loss are excluded.
The PEG-lipid calculator input 2693.32 is a reference average for 14:0 PEG2000 PE, not a measurement of the study lot. DMG-PEG2000 is a different material and remains 2507 in catalog calculations.
For total lipid mass M (mg), molar parts rᵢ and molecular weight MWᵢ: component mass = M × rᵢ × MWᵢ / Σ(r × MW). Component amount (µmol) = component mass (mg) × 1000 / MWᵢ. Molar parts are normalized only for the displayed percentage. The calculation does not infer N/P or RNA dose.
| Parameter | Reported procedure / limitation | Source |
|---|---|---|
| Organic phase | Lipid components dissolved in ethanol at ionizable lipid:DSPC:cholesterol:PEG-lipid 50:10:38.5:1.5 mol%. | Main Methods: mRNA-LNP production |
| Aqueous phase | mRNA at 0.1 mg/mL in 25 mM sodium acetate, pH 5.0. | Main Methods: mRNA-LNP production |
| N/P and mixing | N/P = 4; Y-shaped microfluidic cartridge; total flow 6 mL/min; aqueous:organic flow ratio 3:1. | Main Methods: mRNA-LNP production |
| Purification | Three dialysis exchanges against sterile Ca2+/Mg2+-free PBS using a 3.5 kDa MWCO cassette, followed by concentration through a YM30 centrifugal filter. Duration of each dialysis exchange is not specified. | Main Methods: mRNA-LNP production |
| Final RNA concentration / excipient | 50 µg/mL mRNA, with or without 10% sucrose (w/v); aliquoted for the specified storage conditions. At least two independently prepared batches per LNP type were used. | Main Methods: mRNA-LNP production |
| Particle measurements | DLS at 25 °C; solvent setting water for PBS or 10% sucrose for sucrose-containing samples. RiboGreen used for RNA concentration and encapsulation. | Main Methods: mRNA-LNP characterization |
| Mouse reporter model | 7-week-old female BALB/c mice; 1 µg Fluc mRNA in 20 µL, injected into gastrocnemius muscle; reporter readout 24 h later. | Main Methods: Administration of mRNA-LNP to mice; Bioluminescence imaging |
| Storage design | Aliquoted Fluc mRNA-LNPs at 4 °C or −80 °C; plotted functional tests at weeks 0, 4, 8, 12 and 20. Particle measurements and mouse dosing performed on the same test day. | Fig. 4; Main Methods: mRNA-LNP stability test |
| Measurement / batch | Reported result | Evidence context |
|---|---|---|
| Fresh Fluc-mRNA LNP diameter | 90.2 ± 7.8 nm | Main Results; Fig. 1c. Particle-distribution panels represent two experiments, each using two independent LNP preparations. |
| Encapsulation efficiency | Greater than 95% | Main Results; Fig. 1d; RiboGreen. No precise product-specific mean is invented from the graph. |
| PDI / zeta potential | No numerical values supplied for these batches in the reviewed article/SI | A broader size-distribution curve is not itself a numerical PDI. |
| Apparent pKa cited for the lipid | 6.09 | Fig. 1a and Discussion. Imported from the earlier reference cited by the authors; not a newly measured pKa of this experimental batch. |
| PBS versus 10% sucrose, short 4 °C condition | 83.8 ± 4.6 nm versus 100.1 ± 5.2 nm | Main Results; Fig. 3a |
| Sucrose concentration effect | Size increase observed between 2% and 10% sucrose; no additional increase reported above 10% | Supplementary Fig. 2. Separate from the fresh Fig. 1 measurement batch. |
| Experiment and dose | Readout and comparator | Result and source |
|---|---|---|
| Matched intramuscular reporter comparison ALC-0315 LNP versus the other lipid formulations; 1 µg Fluc mRNA in 20 µL IM; female BALB/c mice; n=6/group | Readout: 24 h; total photon emission in the injection-site region Comparator: SM-102 and cKK-E12 | ALC-0315 and cKK-E12 produced comparable reporter signals. SM-102 mean signal was approximately 60% higher in this matched IM experiment.Fig. 1e–f; mean ± SEM; one-way ANOVA with Tukey comparisons |
| Neutralizing-antibody response Spike-antigen mRNA; 1 µg IM per dose on days 1 and 21; n=10/group | Readout: Plasma collected days 14 and 35; pseudovirus-neutralization endpoint Comparator: Other ionizable-lipid comparators at the same helper-lipid composition | ALC-0315 elicited neutralizing antibodies, with lower titers than SM-102 and cKK-E12 under the matched conditions. All groups increased titers more than 28-fold after boosting.Fig. 2c–f; median Neut50 displayed in violin plots; n=10; no exact Neut50 values extracted |
| Inflammatory markers after prime and boost Same IM antigen-mRNA study, 1 µg per dose; n=10/group | Readout: Day 2 and day 22, each 24 h after dosing Comparator: Pre-immune plasma and cKK-E12 LNP | No significant increase was generally detected for the measured inflammatory panel with SM-102 or ALC-0315 relative to pre-immune plasma. cKK-E12 produced stronger responses for several markers. This is a limited time-point panel, not comprehensive toxicology.Fig. 2b; Supplementary Fig. 1; mean ± SEM |
| Sucrose and short freezing exposure ALC-0315 Fluc mRNA-LNP, PBS ±10% sucrose; held 1 h at 4 °C or frozen at −80 °C then thawed | Readout: DLS after storage / thawing Comparator: Same LNP without sucrose | Sucrose prevented the broad/multiple particle-size peaks observed after freezing and thawing without sucrose. The experiment does not test 20 repeated freeze–thaw cycles.Fig. 3a–b; Supplementary Fig. 2 |
| Functional delivery after short storage 1 µg Fluc mRNA in 20 µL IM after the Fig. 3 storage conditions; n=5/group | Readout: 24 h after injection Comparator: PBS without sucrose and frozen samples with/without sucrose | For refrigerated samples, 10% sucrose increased reporter expression by approximately 30–40%; sucrose preserved functional delivery through the tested freezing–thawing exposure.Fig. 3c–f; mean ± SEM; two-way ANOVA with Sidak comparisons |
| Long-term formulated-particle storage ALC-0315 Fluc mRNA-LNP at 50 µg/mL; 10% sucrose; 4 °C versus −80 °C; 1 µg IM test dose; n=5/group per functional readout | Readout: Weeks 0, 4, 8, 12 and 20; mouse imaging 24 h after each test injection Comparator: Week-0 activity and the other ionizable-lipid formulation | ALC-0315 showed a greater relative loss of functional activity than SM-102 at 4 °C. Both developed aggregation around week 8; activity was retained at −80 °C across the tested period.Fig. 4a–d; mean ± SEM; within-group comparisons to week 0 |
| Encapsulation versus functional stability Same storage study; formulated Fluc mRNA-LNP | Readout: Particle/encapsulation monitoring; RNA gel at week 20 Comparator: 4 °C versus −80 °C | Encapsulation remained high while refrigerated functional potency declined. Gel analysis showed comparable detectable RNA after 20 weeks at both temperatures; retained encapsulation or RNA band intensity did not guarantee retained delivery activity.Fig. 4b,e; gel representative of two independent LNP preparations |
The authors discuss ionization and endosomal escape as possible contributors to the matched delivery difference. They did not directly measure comparative endosomal-escape rates here. Aggregation correlated with loss of refrigerated reporter potency, while RNA remained detectable; the study does not prove one exclusive molecular cause of instability.
Results apply to the stated LNP composition, cargo, process, dose, route and model. LNP experimental measurements are not batch-release specifications for the isolated lipid.
Zhang L, More KR, Ojha A, et al. Effect of mRNA-LNP components of two globally-marketed COVID-19 vaccines on efficacy and stability. npj Vaccines 8, 156 (2023).
DOI: 10.1038/s41541-023-00751-6
PEG-lipid identity and molecular-weight reference
Download experiment table (CSV) · Open printable Formulation & Performance guide
Revision FP-20261024-b3 · Source review: 24 October 2026 · DC Chemicals
Original publication figures illustrating the cited formulation and biological results. Select an image to view it at full size.
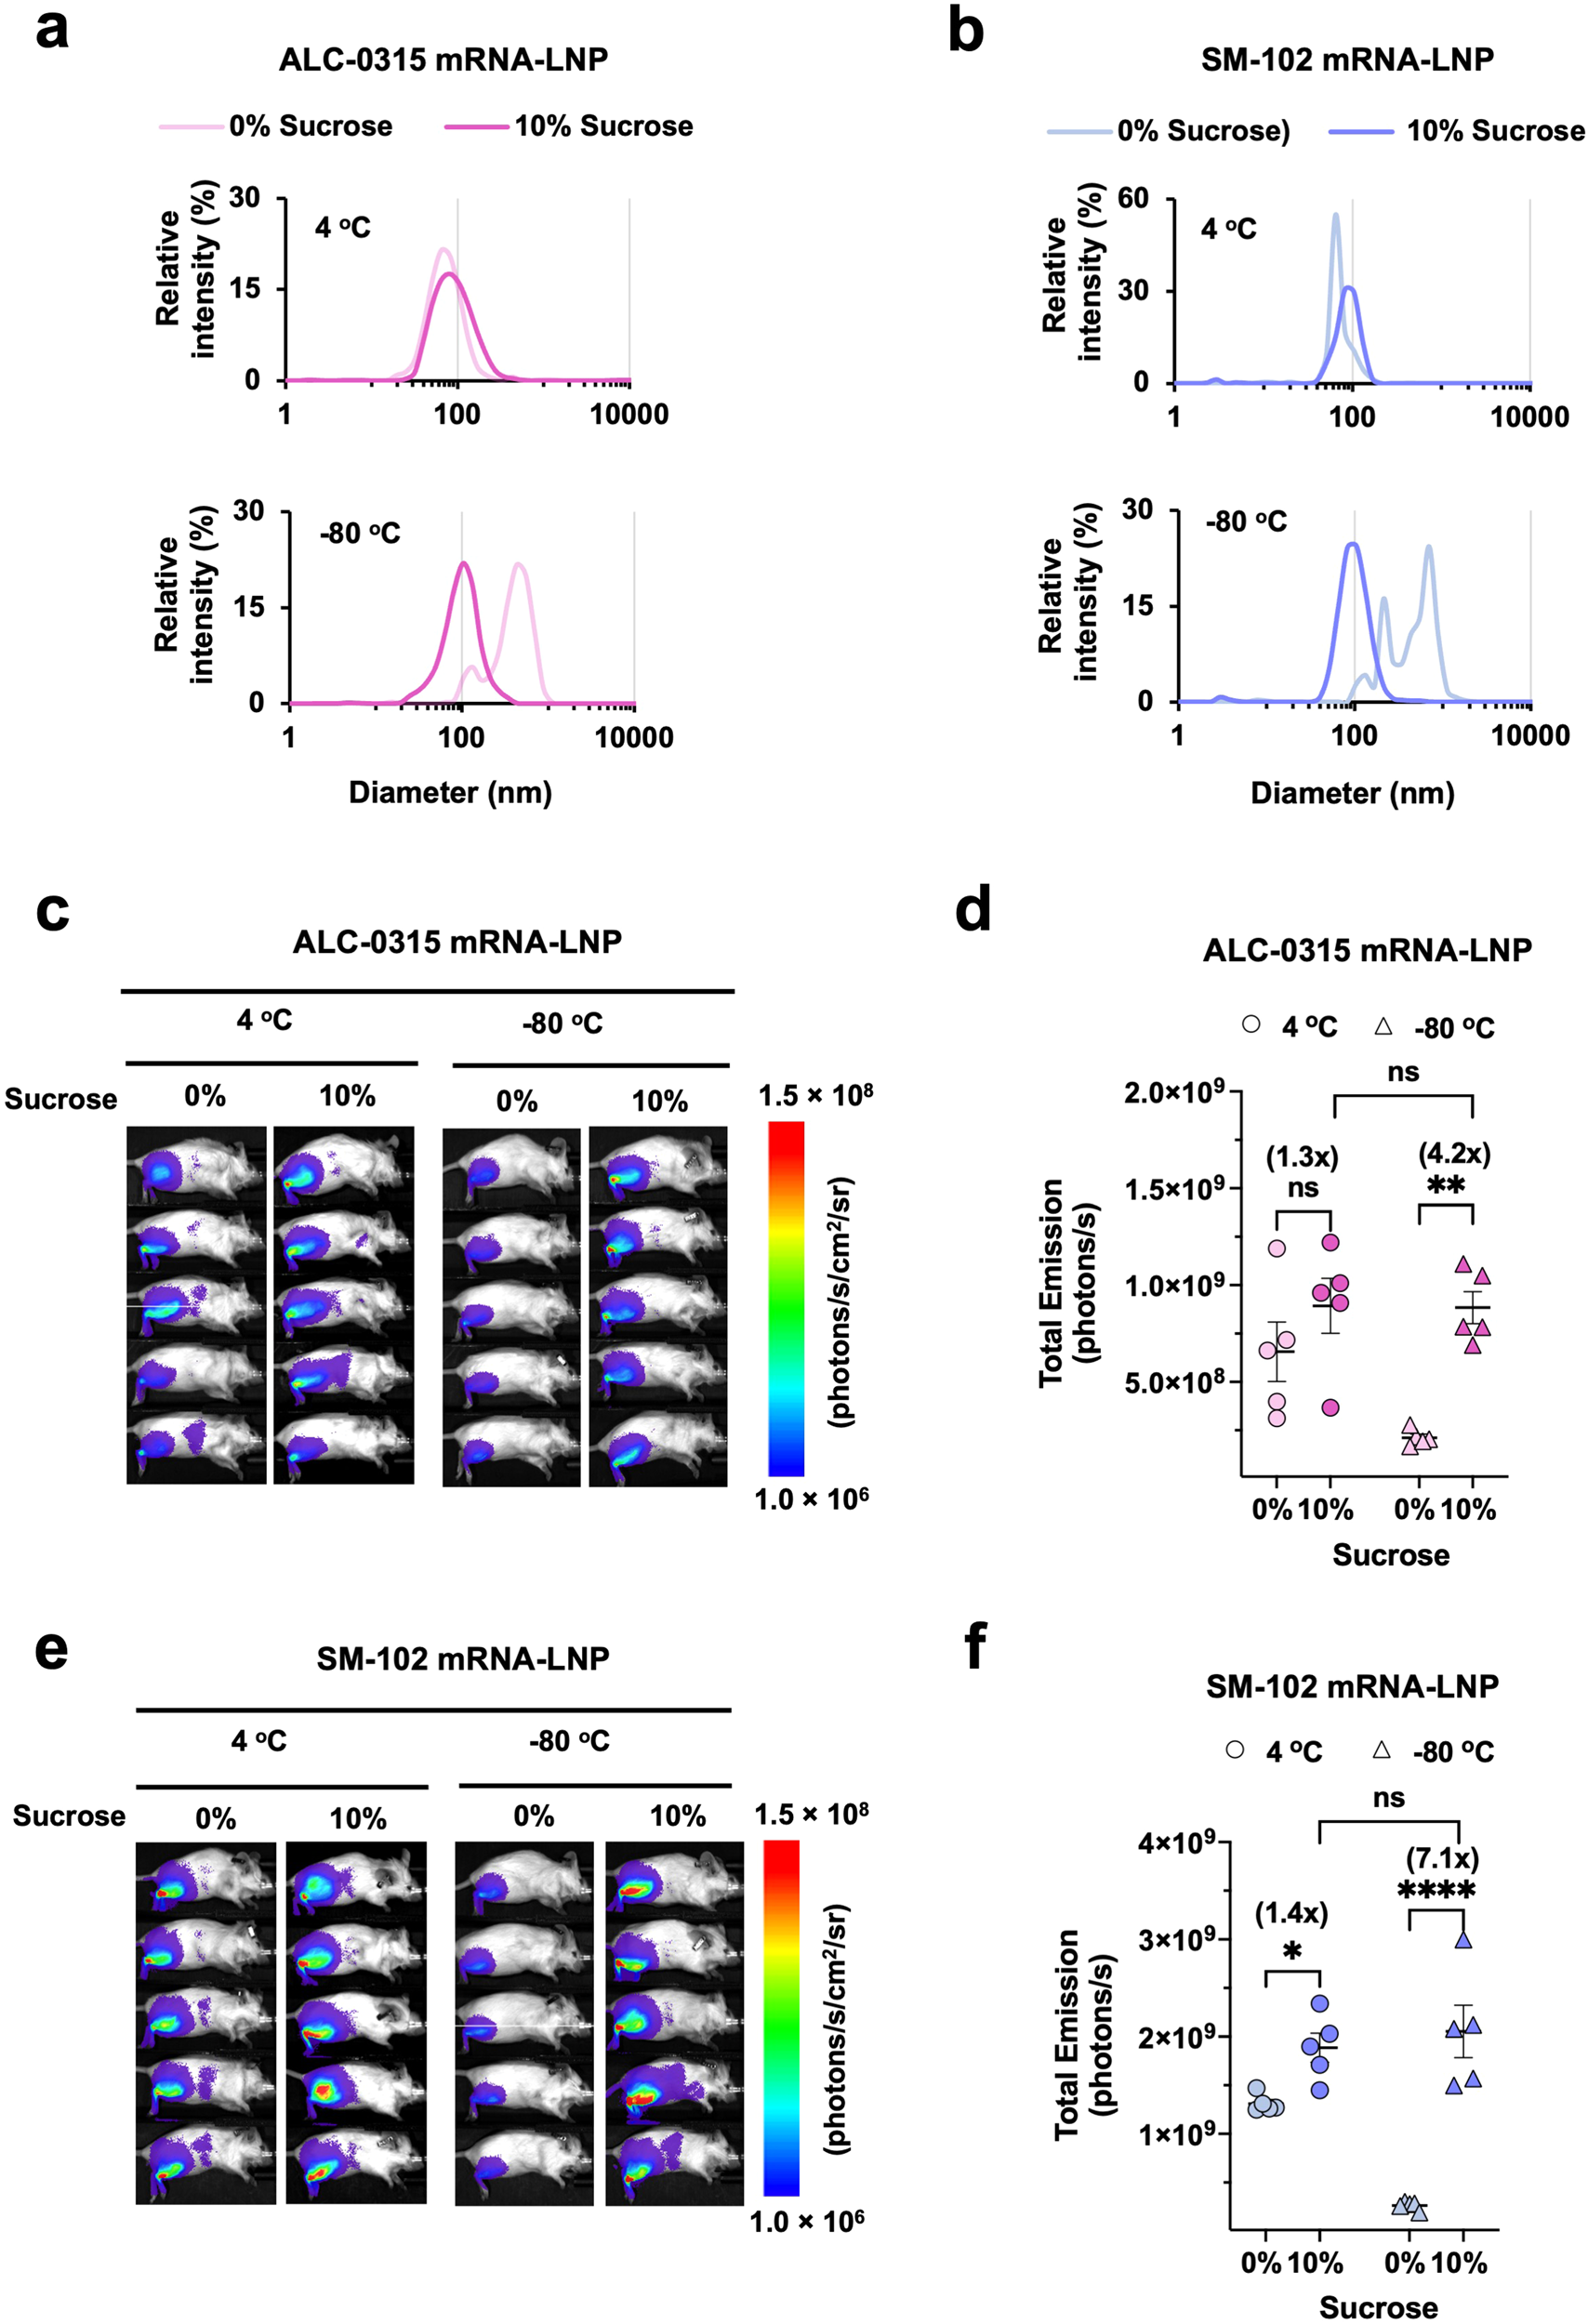
The original panels compare ALC-0315 and SM-102 formulations with or without sucrose. Particle-size profiles and mouse imaging show that formulation and storage conditions influence subsequent expression. LNPs held for 1 hour at 4°C or −80°C, with or without 10% sucrose; 1 µg FLuc mRNA IM; imaging at 24 hours; n=5 mice/group.
Zhang et al. (2023), npj Vaccines, Figure 3. CC BY 4.0. Original figure unchanged. Original article / figure · CC BY 4.0. Unmodified complete original figure; displayed at responsive size.
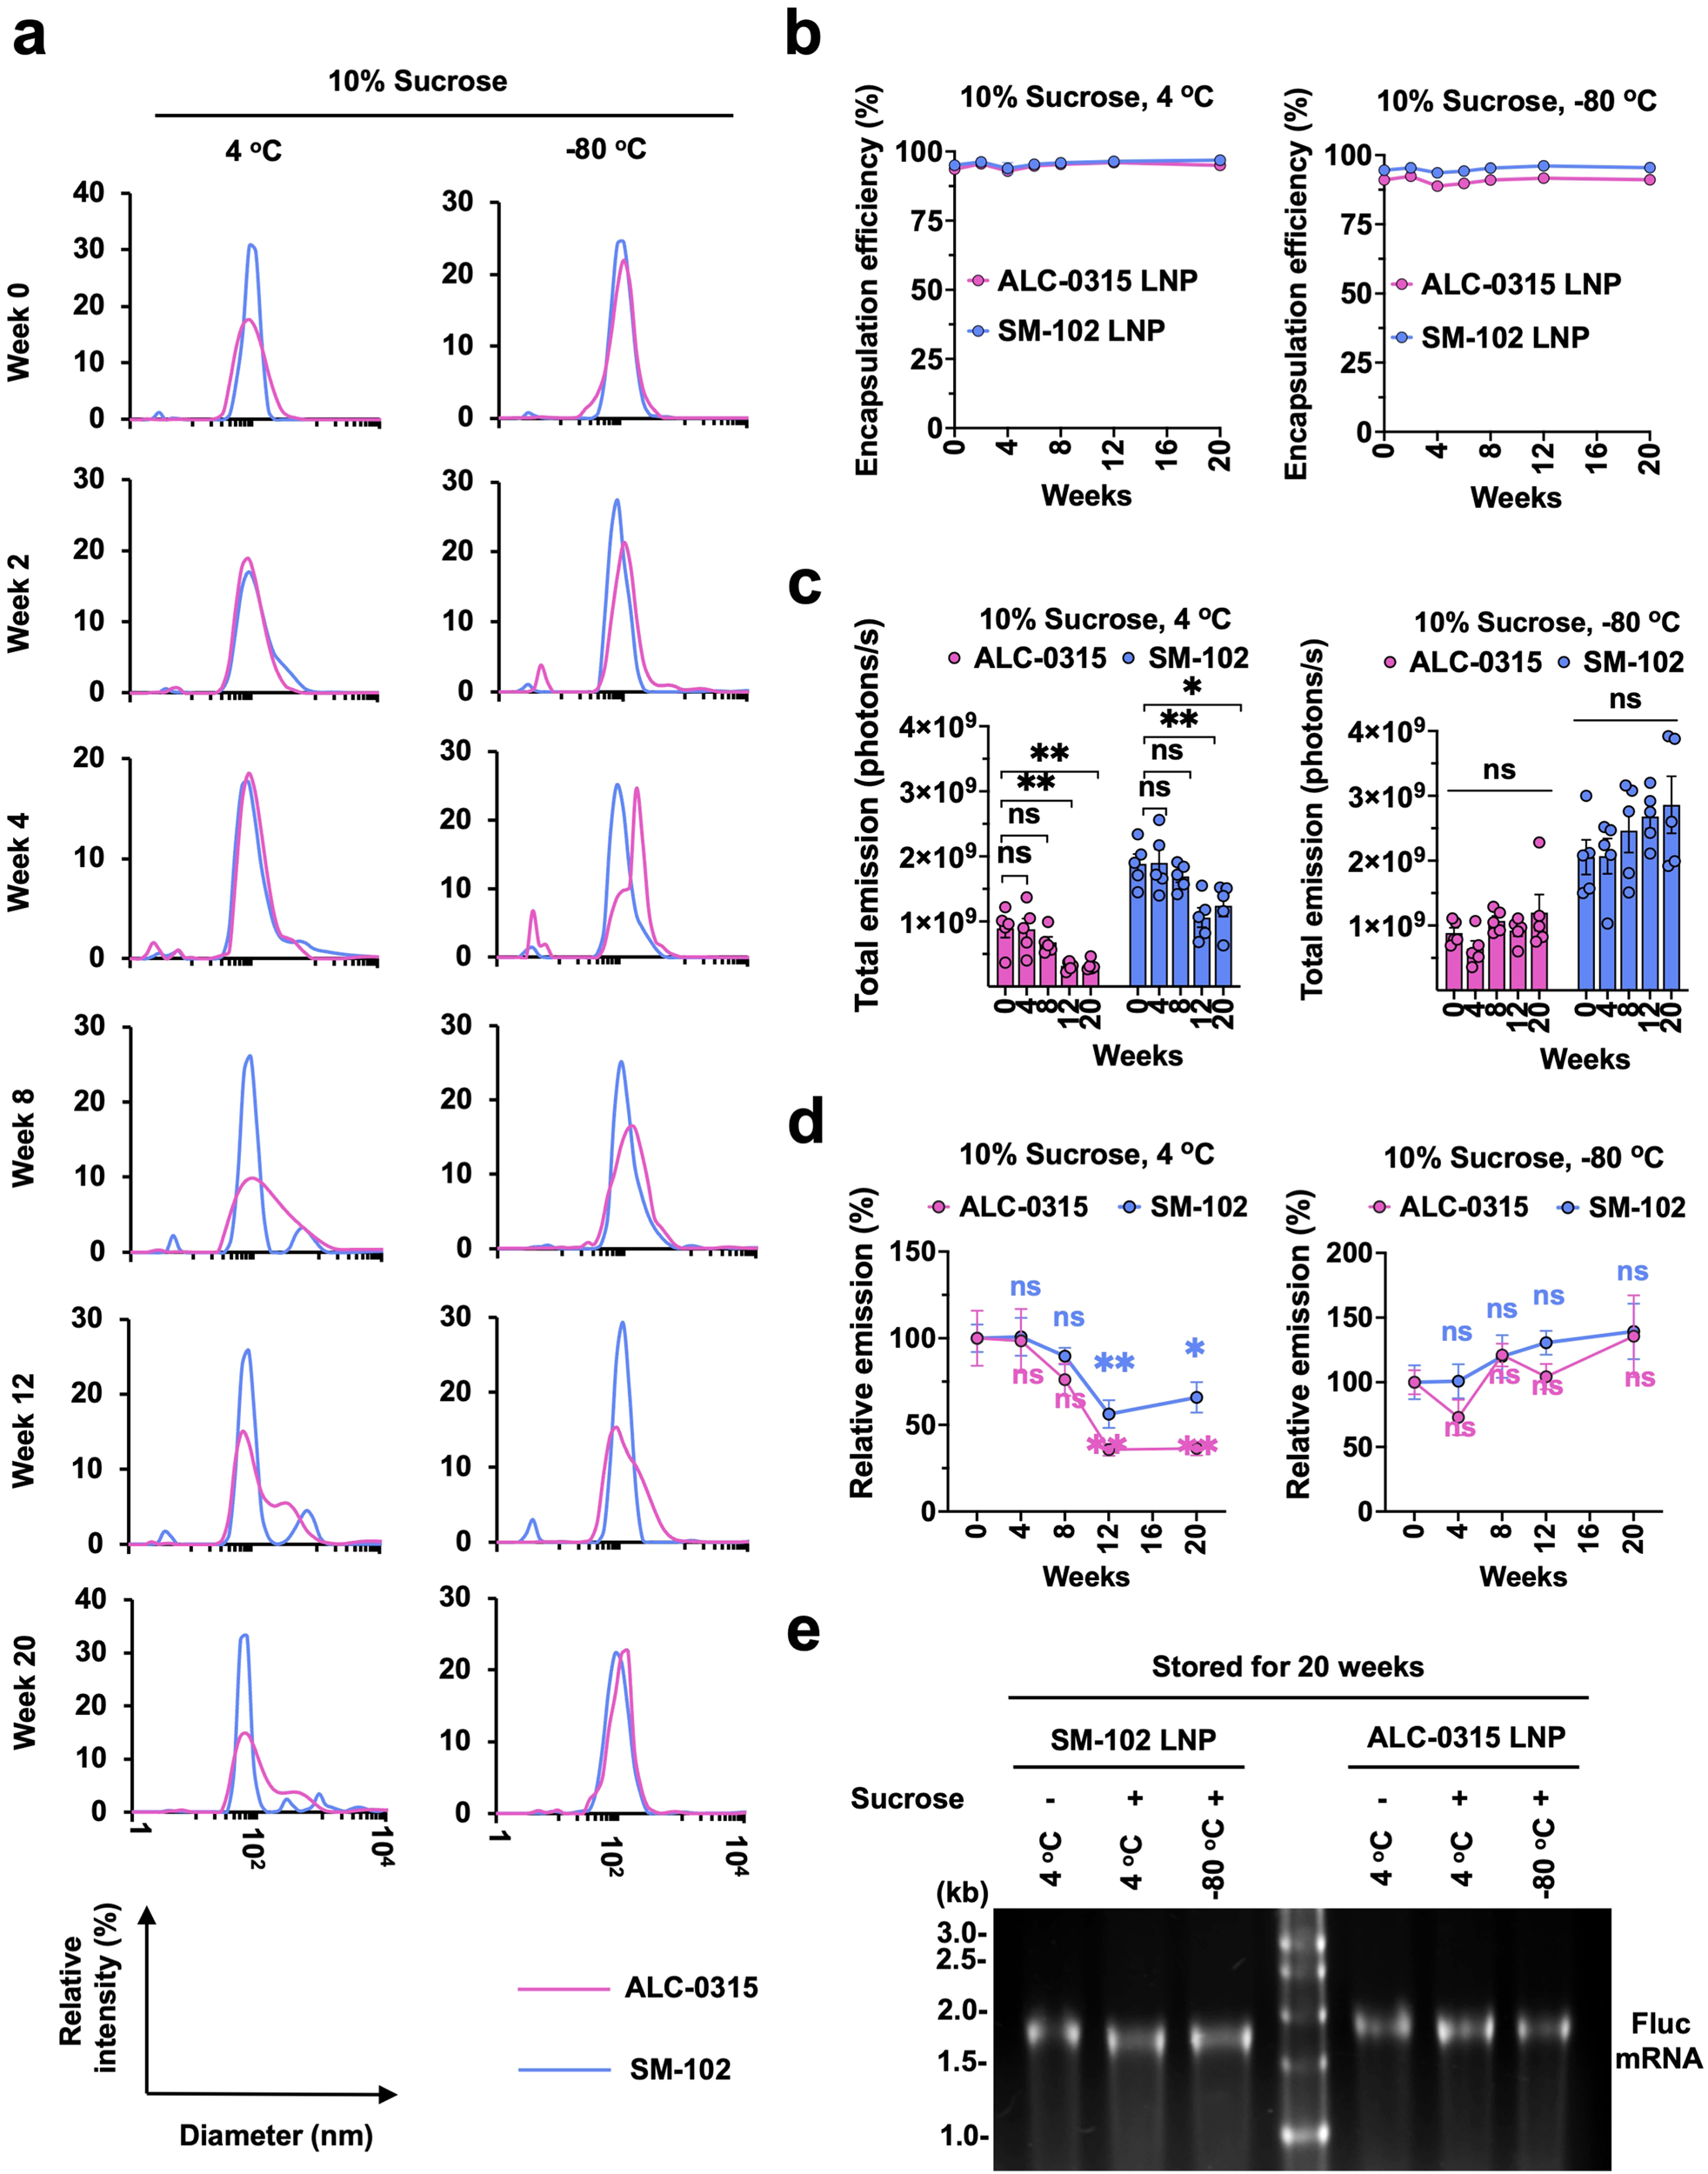
ALC-0315 and SM-102 formulations are compared through particle size, RNA encapsulation, mouse expression and RNA integrity. These are formulated-LNP stability results, not the shelf life of neat lipid. Storage at 4°C or −80°C; reporter expression measured 24 hours after injection of stored formulations; mean ± SEM, n=5 mice/group.
Zhang et al. (2023), npj Vaccines, Figure 4. CC BY 4.0. Original figure unchanged. Original article / figure · CC BY 4.0. Unmodified complete original figure; displayed at responsive size.
The product molecular weight is prefilled when available and remains editable. Confirm solvent compatibility and solubility before preparation.
Do not substitute DMG-PEG2000 or ALC-0159 for 14:0 PEG2000 PE. N/P 4 is distinct from a lipid:mRNA mass ratio.
Solvent volumes update from the molecular weight above.
| Mass | 1 mM | 5 mM | 10 mM |
|---|---|---|---|
| 10 mg | 13.0502 mL | 2.6100 mL | 1.3050 mL |
| 25 mg | 32.6256 mL | 6.5251 mL | 3.2626 mL |
| 50 mg | 65.2512 mL | 13.0502 mL | 6.5251 mL |
| 100 mg | 130.5023 mL | 26.1005 mL | 13.0502 mL |
| 250 mg | 326.2558 mL | 65.2512 mL | 32.6256 mL |
Contact our team with the catalog number and requested quantity.