
| Parameter | Value |
|---|---|
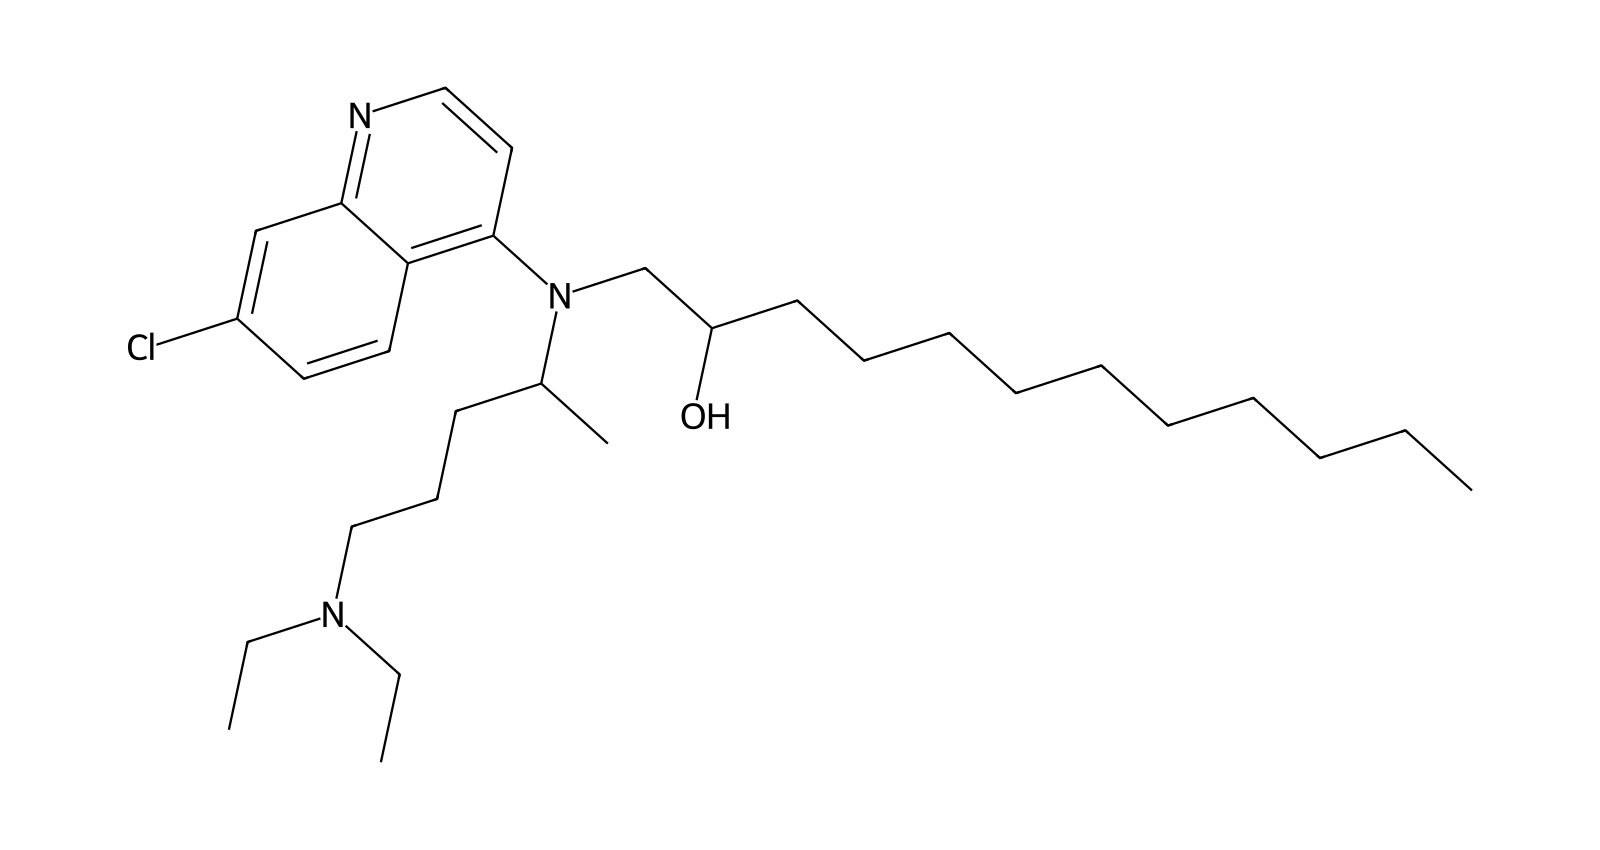
| Chemical Name | CQ-12 |
| CAS No. | Not available |
| Synonyms | CQ12; CQ 12; AUDI-lipidoid CQ12; Chloroquine-C12 lipidoid |
| Formula | C30H50ClN3O |
| M.Wt | 504.2 |
| SMILES | CCCCCCCCCCC(O)CN(c1ccnc2cc(Cl)ccc12)C(C)CCCN(CC)CC |
| Purity | >95% by ELSD-HPLC |
| Storage | Follow the supplied batch label; protect from light and moisture. Compound-specific stock-solution shelf life is not established. |
| Publication | Zhou T-Q, Sun W, Yang H, Zhang G, Naeem A, Weng Y, Zhu M, Wei Z-Z, Huang Y, Liang X-J. Autolysosomal degradation-inhibitory nanoparticles for enhanced mRNA escape and cytokine therapy. Cell Biomaterials. Article in press (2026), article 100593. doi:10.1016/j.celbio.2026.100593. DOI: 10.1016/j.celbio.2026.100593 |
Study overview
CQ-12 is the C12-chain lead from a chloroquine–epoxide lipidoid series. It is used together with a parent ionizable lipid to inhibit downstream autophagic degradation and improve mRNA expression. The evidence below is from the supplied full article and Figures S1–S34 / Tables S1–S5.
Literature results are formulation- and experiment-specific; they are not product release specifications or guaranteed performance.
Five-component formulations and matched controls
30% substitution means replacing 30% of the original ionizable-lipid molar fraction. For SM-102/MC3, 50 mol% becomes 35 mol% parent lipid plus 15 mol% CQ-12. For ALC-0315, 46.3 mol% becomes 32.41 mol% plus 13.89 mol% CQ-12. All six Table S2 recipes sum to 100 mol%.
| Formulation | Component order | Molar ratio | Diameter (nm) | PDI | Zeta potential (mV) | Encapsulation (%) | Apparent LNP pKa |
|---|---|---|---|---|---|---|---|
| SM-102 parent | SM-102 / DSPC / cholesterol / DMG-PEG2000 | 50:10:38.5:1.5 | 127.7±1.4 | 0.141 | −0.74±13.4 | 95.91±0.01 | 6.77 |
| SM-102 AUDI | SM-102 / CQ-12 / DSPC / cholesterol / DMG-PEG2000 | 35:15:10:38.5:1.5 | 123.7±0.4 | 0.105 | 0.33±5.50 | 94.92±0.03 | 6.57 |
| MC3 parent | MC3 / DSPC / cholesterol / DMG-PEG2000 | 50:10:38.5:1.5 | 133.8±0.9 | 0.153 | −0.23±0.17 | 91.59±0.30 | 6.30 |
| MC3 AUDI | MC3 / CQ-12 / DSPC / cholesterol / DMG-PEG2000 | 35:15:10:38.5:1.5 | 125.3±2.7 | 0.122 | 0.58±1.24 | 88.90±0.25 | 6.20 |
| ALC-0315 parent | ALC-0315 / DSPC / cholesterol / ALC-0159 | 46.3:9.4:42.7:1.6 | 139.0±0.1 | 0.083 | −1.57±3.14 | 95.62±0.03 | 6.30 |
| ALC-0315 AUDI | ALC-0315 / CQ-12 / DSPC / cholesterol / ALC-0159 | 32.41:13.89:9.4:42.7:1.6 | 131.8±2.4 | 0.091 | 0.34±2.24 | 94.26±1.79 | 6.07 |
Source: SI Table S2; Fig. 2G–J and Fig. S19.
pKa was measured by TNS fluorescence and belongs to the formulated nanoparticle, not isolated CQ-12. Table S2 values are reproduced as reported; uncertainty is shown only where supplied. The pKa values for SM-102 AUDI-LNPs in the separate substitution and chain-length screens are 6.47 (S4) and 6.51 (S5), respectively.
Component molecular weights and mass-ratio tables
Calculated input masses per 100 mg total lipid follow mᵢ = 100 × (mol%ᵢ × MWᵢ) / Σ(mol% × MW). These are lipid-only calculations, before purification or recovery losses. DMG-PEG2000 uses the catalog convention 2507.
SM-102 AUDI-LNP
| Component | Molecular weight | mol% | Mass / 100 mg total lipid (mg) |
|---|---|---|---|
| SM-102 | 710.17 | 35 | 42.152 |
| CQ-12 | 504.20 | 15 | 12.826 |
| DSPC | 790.15 | 10 | 13.400 |
| Cholesterol | 386.65 | 38.5 | 25.245 |
| DMG-PEG2000 | 2507 | 1.5 | 6.377 |
MC3 AUDI-LNP
| Component | Molecular weight | mol% | Mass / 100 mg total lipid (mg) |
|---|---|---|---|
| DLin-MC3-DMA | 642.11 | 35 | 39.717 |
| CQ-12 | 504.20 | 15 | 13.366 |
| DSPC | 790.15 | 10 | 13.964 |
| Cholesterol | 386.65 | 38.5 | 26.307 |
| DMG-PEG2000 | 2507 | 1.5 | 6.646 |
MC3 calculation uses average molecular weight 642.11 from C43H79NO2; an exact-mass value must not be substituted for average molecular weight. SM-102, DSPC and cholesterol calculation inputs are 710.17, 790.15 and 386.65, respectively. Replace nominal PEG-lipid values with verified batch-average values when available.
ALC-0315 AUDI-LNP
| Component | Molecular weight | mol% | Mass calculation |
|---|---|---|---|
| ALC-0315 | 766.27 | 32.41 | Pending ALC-0159 batch-average MW |
| CQ-12 | 504.20 | 13.89 | Pending ALC-0159 batch-average MW |
| DSPC | 790.15 | 9.4 | Pending ALC-0159 batch-average MW |
| Cholesterol | 386.65 | 42.7 | Pending ALC-0159 batch-average MW |
| ALC-0159 | Batch-average value required | 1.6 | Not calculated |
The ALC-0159 batch-average molecular weight is not supplied in the paper, so a falsely precise total-mass recipe is not shown for this formulation. ALC-0159 is the PEG lipid in this branch; DMG-PEG2000 belongs to the SM-102 and MC3 branches.
Preparation and dosing basis
| Parameter | Reported information |
|---|---|
| Preparation | Ethanol injection; ethanol lipid phase:aqueous RNA phase = 1:3 v/v. |
| Aqueous phase | Citrate buffer pH 4.0; buffer concentration not specified. |
| Mass ratio | The source states lipidoid/RNA = 20:1 w/w. It does not unambiguously define whether the numerator includes all five lipids. |
| N/P | Not reported. The 20:1 mass ratio is not N/P. |
| Post-processing | Source describes PBS exchange using a 30 kDa centrifugal ultrafiltration device at 3,000 rpm for 15 min, followed by 0.22 µm filtration and 4 °C storage. |
| Storage duration | No validated formulation or neat-product shelf life is established. |
| Characterization | DLS size/PDI/zeta, TEM morphology, RiboGreen encapsulation, and TNS apparent pKa. |
Source: Methods, printed p. 17.
Formulation-specific performance and experimental conditions
| Endpoint | Finding | Conditions / comparator | Source |
|---|---|---|---|
| Lead selection | CQ12 was the highest-expression C6–C18 analogue at the selected 30% SM-102 substitution. | SM-102 base; HEK293T; luciferase mRNA 200 ng/well; 12 h; n=3; comparator: CQ6/8/10/14/16/18 and other substitution ratios | Fig. 2C–E; SI Tables S4–S5 |
| Luciferase expression | Approximately 5.3-fold higher expression than unmodified LNPs in HEK293T cells. This is not a general in vivo fold change. | AUDI-LNPs SM-102; 200 ng mRNA/well; 12 h; n=3; comparator: Unmodified SM-102 LNPs | Main p. 9; Fig. 4C |
| Compatibility | CQ12 substitution improved reporter expression for SM-102, MC3 and ALC-0315 parent formulations. No exact cross-formulation fold values are tabulated. | HEK293T; 200 ng luciferase mRNA/well; 12 h; n=3; comparator: Matched parent LNPs and free CQ plus parent LNPs | Fig. 4D; SI Table S2 |
| Cell breadth | Higher reporter expression reported in HEK293T, DC2.4, B16, mouse epidermal keratinocytes and mouse lung fibroblasts. | Luciferase mRNA 200 ng/well; 12 h; n=3; comparator: Matched LNP and CQ+LNP controls | Fig. 4C; SI Fig. S33 |
| EGFP expression | Higher EGFP expression with AUDI-LNPs; Fig. 4F plots relative mean fluorescence intensity, despite caption wording referring to positive cells. No exact positive-cell percentage assigned. | HEK293T; EGFP mRNA 2 µg/mL; 12 h; n=3; comparator: LNPs and free CQ+LNPs | Fig. 4E–F; Methods p. 17 |
| Autophagic flux | Accumulation of dual-color LC3 puncta, increased LC3-II/LC3-I and p62, and TEM observations support inhibited downstream autophagic degradation. | HEK293T; western blot and TEM 6 h; Cy5-RNA/LC3 colocalization 4 h; comparator: LNPs and free CQ+LNPs | Fig. 3C–H; SI Fig. S22 |
| RNA escape imaging | No significant difference at 2 h; higher relative signal outside endo/lysosomal regions at 6 h. An absolute escape percentage is not tabulated. | HEK293T; microscopy; n=4 fields; method uses Cy5-siRNA:mLuc 1:2; comparator: LNPs and free CQ+LNPs | Fig. 4G–I; Methods p. 18 |
| Subcutaneous reporter | Stronger injection-site expression at 12 and 24 h; 2 h comparison is marked nonsignificant. | BALB/c mice; 5 µg luciferase mRNA/mouse; single dorsal subcutaneous injection; imaging 2/12/24 h; n=3; comparator: LNPs and free CQ+LNPs | Fig. 6A–C |
| Subcutaneous IL-10 | Increased IL-10 staining in skin at 12 h after local delivery. Separate skin autophagy-marker assay uses mLuc at 6 h. | BALB/c; 5 µg IL-10 mRNA/mouse; dorsal subcutaneous administration; comparator: LNPs and free CQ+LNPs | Fig. 6D–F |
| Intratracheal reporter | Higher lung reporter signal after local airway delivery; this is not evidence of lung targeting after intravenous dosing. | C57BL/6; 5 µg luciferase mRNA/mouse; intratracheal instillation; 24 h; n=3; comparator: LNPs and free CQ+LNPs | Main p. 11; Fig. 6G–I |
| Intravenous reporter | Higher systemic reporter expression with liver/spleen signals reported. | BALB/c; 5 µg luciferase mRNA/mouse; single tail-vein injection; 24 h in SI; n=3; comparator: LNPs and free CQ+LNPs | Fig. 6J–L; SI Fig. S29 |
| Psoriasis model | Reported reductions versus model group: scaling 72.73%, erythema 83.33%, and skin thickness 53.5%; lower inflammatory-marker signals. | IMQ-induced BALB/c; IL-10 mRNA 5 µg/mouse; dorsal subcutaneous treatment on day 1; day-5 tissue assessment; comparator: Model, reporter-mRNA AUDI-LNP, IL-10 LNP, free CQ+IL-10 LNP | Main p. 13; Fig. 7; Methods p. 19 |
| Acute lung injury | Lung wet/dry ratio: model 5.84±0.18, TGF-β AUDI-LNP 4.52±0.25, healthy control 4.23±0.15. Authors report ~22.67% reduction versus model; rounded means give ~22.60%. | LPS-induced C57BL/6; TGF-β mRNA 5 µg/mouse; intratracheal treatment 24 h after LPS; evaluate 48 h after treatment; comparator: Healthy/model, reporter control and TGF-β LNP/CQ+LNP comparators | Main p. 15; Fig. 8G; Methods p. 19 |
| Hyperuricemia model | Lower serum uric acid with Uox-mRNA AUDI-LNPs than the comparator groups; no exact effect size assigned. | C57BL/6; Uox mRNA 5 µg/mouse; IV according to Results; intervention 12 h before adenine/oxonate induction; comparator: Healthy/model, reporter control, Uox LNP and CQ+Uox LNP | Main p. 13 and 18–19; SI Fig. S34 |
| Cell viability | At 300 ng/well the main text reports viability around 80%; at 200 ng/well it remains above 85%. SI Fig. S27 gives a more general no-obvious-cytotoxicity description. | HEK293T dose series; context-specific viability, not neat-chemical toxicology; comparator: LNP and CQ+LNP controls | Main p. 9; Fig. 4B; SI Fig. S27 |
| Acute tolerability | No significant differences in displayed liver/kidney chemistry; no obvious pathology in representative organ images. No chronic or human safety inference. | BALB/c; IV 5 µg luciferase mRNA/mouse; serum at 24 h; n=3. Separate SC/IV IL-10 histology.; comparator: PBS, LNP and free CQ+LNP | SI Figs. S28/S30/S31; Table S3 |
Substitution and chain-length screens
| Dataset | Condition | Diameter (nm) | PDI | Encapsulation (%) | Apparent pKa |
|---|---|---|---|---|---|
| S4 substitution screen | 30% replacement; 35:15:10:38.5:1.5 | 123.00±1.10 | 0.105±0.017 | 93.86±1.94 | 6.47 |
| S4 substitution screen | 75% replacement; 12.5:37.5:10:38.5:1.5 | 189.50±11.00 | 0.258±0.016 | 76.12±5.50 | 6.32 |
| S4 substitution screen | 100% replacement; CQ12:DSPC:Chol:PEG 50:10:38.5:1.5 | 207.57±12.02 | 0.266±0.032 | 71.94±6.00 | 6.15 |
| S5 chain-length screen | C12 at 30% replacement | 121.13±2.40 | 0.112±0.013 | 93.50±0.66 | 6.51 |
Source: SI Tables S4–S5; values are separate experiments, not pooled with S2.
In S4 the printed 1% recipe (45:0.5:10:38.5:1.5) sums to 95.5 and the 10% recipe (40:5:10:38.5:1.5) sums to 95. These two source entries require clarification and are excluded from mass calculations. The selected 30% recipe is consistent across Fig. 2E and S2/S4/S5.
Structure and analytical identity
The C12 epoxide ring-opening product is attached to the exocyclic quinoline amino nitrogen, giving an N-linked 2-hydroxydodecyl group. The terminal diethylamino group is retained. Two stereocenters are unspecified. The source depicts the neutral parent; no salt stoichiometry or counterion is assigned.
| Identity item | Evidence |
|---|---|
| Formula | C30H50ClN3O, calculated from the structure in main Fig. 2D and SI Figs. S1/S4. |
| Average molecular weight | 504.20, calculated from the verified neutral structure. |
| HRMS [M+H]+ | Calculated 504.3721; observed 504.3695 (SI Table S1, Fig. S4 and Methods). |
| NMR / chromatography | 1H NMR in CDCl3: SI Fig. S11; HPLC chromatogram and PDA spectra: SI Fig. S3. No commercial-batch purity is inferred from these figures. |
| Synthesis | Chloroquine and 1,2-epoxydodecane ring opening; purified product yield 42% (Methods p. 17). |
| SMILES | CCCCCCCCCCC(O)CN(c1ccnc2cc(Cl)ccc12)C(C)CCCN(CC)CC |
Source: Main Fig. 2A/D; Methods p.17; SI Figs. S1/S3/S4/S11 and Table S1.
Interpretation limits
The local intratracheal results do not demonstrate lung targeting after systemic dosing. The 5.3-fold value is the HEK293T reporter comparison, not a universal animal or cargo effect. Inhibition of autophagy may be unsuitable where autophagic clearance is therapeutically important; the authors identify chronic dosing and safety-window studies as future work.
The article has internal timing/label differences: Fig. 3C is described as 6 h in text/methods and 12 h in the caption; Fig. 4F plots relative MFI despite a positive-cell caption; source viability statements differ at the highest dose. These are retained as limits rather than silently harmonized. Raw Source Data were not supplied, so graph-only exact values are not assigned.
References
Zhou T-Q, Sun W, Yang H, Zhang G, Naeem A, Weng Y, Zhu M, Wei Z-Z, Huang Y, Liang X-J. Autolysosomal degradation-inhibitory nanoparticles for enhanced mRNA escape and cytokine therapy. Cell Biomaterials. Article in press (2026), article 100593. doi:10.1016/j.celbio.2026.100593. Article and Supplementary Information.
The supplied PDF carries a 2026 article-in-press citation and a future issue footer (volume 3, 18 May 2027). The DOI is the stable reference used here. Supplementary pages cited above use the printed SI numbering.