
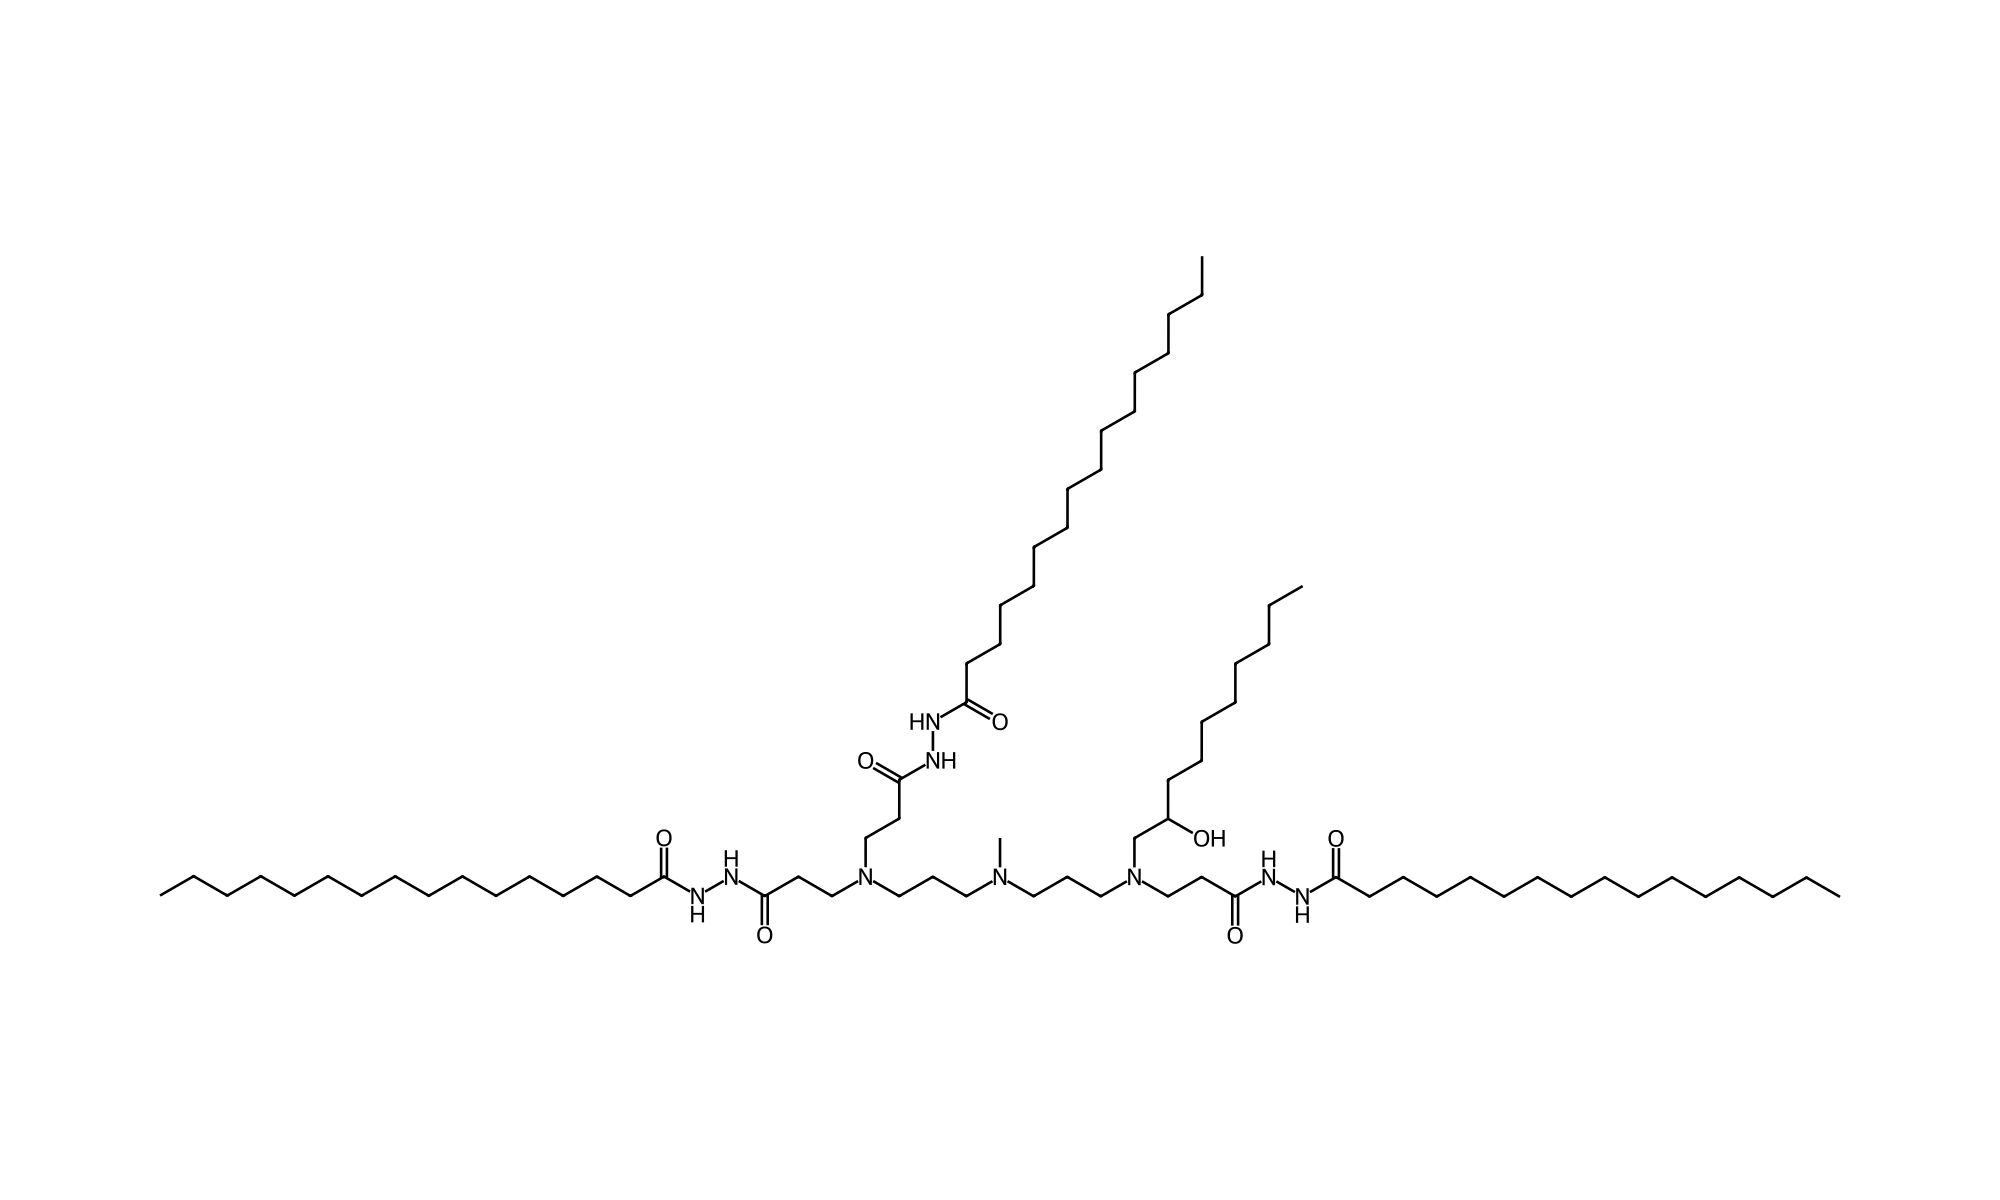
| Parameter | Value |
|---|---|
| Chemical Name | Lipid-392 |
| CAS No. | Not available |
| Synonyms | Lipid 392; Lipid392; NNCC14 |
| Formula | C74H147N9O7 |
| M.Wt | 1275.05 |
| SMILES | CCCCCCCCCCCCCCCC(=O)NNC(=O)CCN(CCCN(C)CCCN(CCC(=O)NNC(=O)CCCCCCCCCCCCCCC)CC(O)CCCCCCCC)CCC(=O)NNC(=O)CCCCCCCCCCCCCCC |
| Purity | >95% by ELSD-HPLC |
| Storage | Follow the supplied batch label; protect from light and moisture. Compound-specific stock-solution shelf life is not established. |
| Publication | Fei Y, Lin Y, Liu P, Zhong K, Gao Y, Ma Q, Zhou Z, Luo S, Hu R, Cheng Q. Optimization of Lipid Nanoparticles for Safe and Versatile Lung-Targeted RNA Delivery and Disease Therapy. ACS Nano. 2026;20:15347–15362. doi:10.1021/acsnano.6c03013. DOI: 10.1021/acsnano.6c03013 |
Lead selection and study scope
Lipid-392 stLNP is the author-selected lead for intravenous lung RNA delivery. The work optimizes formulations of Lipid-392 rather than ranking a library of different lipid molecules. The final system removes cholesterol, selects POPE, adjusts N/P to 10 and uses 20 mM acetate at pH 4.0. Evidence includes mouse reporter expression, acute tolerability, Cre recombination, base editing, siRNA knockdown and an IL-10 treatment model.
Reported literature outcomes are specific to the tested formulation and experimental conditions; they are not batch release specifications or guaranteed performance.
Final formulation: cholesterol-free Lipid-392 stLNP
| Component | Catalog number | mol% | Role |
|---|---|---|---|
| Lipid-392 | DCL0020 | 90 | Ionizable carrier |
| POPE | DC65745 | 8.5 | Helper phospholipid |
| DMG-PEG2000 | DC40169 | 1.5 | PEG lipid |
Source: Fig.2E; Results p.15351; Fig.3A–C; Methods p.15357.
Component molecular weights and mass-ratio tables
Calculated lipid-only quantities: mass fraction = (mol% × molecular weight) / Σ(mol% × molecular weight). Input molecular weights are shown as numbers; DMG-PEG2000 uses the catalog convention 2507. POPE uses 718.00, consistent with the catalog formula C39H76NO8P. These calculations do not include RNA, water, counterions, solvent, purification loss or overage.
Final stLNP — 90:8.5:1.5 mol%
| Component | Molecular weight | mol% | Mass per 100 mg total lipid | Mass per 100 mg Lipid-392 |
|---|---|---|---|---|
| Lipid-392 | 1275.05 | 90 | 92.085 mg | 100.000 mg |
| POPE | 718.0 | 8.5 | 4.897 mg | 5.318 mg |
| DMG-PEG2000 | 2507 | 1.5 | 3.018 mg | 3.277 mg |
Initial G4 comparator — 50:10:38.5:1.5 mol%
| Component | Molecular weight | mol% | Mass per 100 mg total lipid | Mass per 100 mg Lipid-392 |
|---|---|---|---|---|
| Lipid-392 | 1275.05 | 50 | 70.600 mg | 100.000 mg |
| DSPC | 790.15 | 10 | 8.750 mg | 12.394 mg |
| Cholesterol | 386.65 | 38.5 | 16.485 mg | 23.350 mg |
| DMG-PEG2000 | 2507 | 1.5 | 4.164 mg | 5.899 mg |
N/P 10 is a molar nitrogen-to-phosphate ratio, not a 10:1 lipid-to-RNA mass ratio. The source does not unambiguously define which nitrogens enter its N/P calculation. Lipid-392 contains three tertiary amines and six hydrazide nitrogens; they must not automatically be treated as nine equivalent protonatable amines. An RNA-to-total-lipid mass calculator is therefore not supplied.
Preparation and characterization
| Parameter | Reported information |
|---|---|
| Buffer | 20 mM acetate, pH 4.0 (B6) |
| N/P | 10, selected in the N/P screen |
| Mixing | Rapid mixing of RNA-containing aqueous buffer with the ethanol lipid phase; aqueous:ethanol = 3:1 v/v. No microfluidic flow-rate setting is reported. |
| Incubation | 10 minutes at room temperature after mixing |
| Buffer exchange | Dialysis against 1×PBS, pH 7.4, for 4 h using a 100 kDa MWCO membrane |
| Size / morphology | Cryo-TEM: well-dispersed spherical particles below 100 nm. DLS, PDI and EE are plotted in the SI; exact numerical means are not tabulated. |
| Apparent pKa | 7.67 for the formulated stLNP, measured by TNS fluorescence with half-maximal fitted signal; pH 2.5–11, n=3. |
| Encapsulation | RiboGreen; EE = (total RNA − free RNA) / total RNA ×100. No exact final value transcribed from a graph. |
| Physical stability | SI S9 monitors size/PDI/EE through day 9; main text describes one week. Storage temperature and validated shelf life are not established by this result. |
Source: Methods p.15357; Fig.3D–E; SI S9.
Sequential optimization: keep each comparison separate
| Step | Selected condition | Matched comparison | Reported change |
|---|---|---|---|
| Ionizable lipid fraction | G8, 90 mol% Lipid-392 | G4,50 mol% | ~12-fold lung expression |
| Cholesterol removal | G8-5,90:8.5:0:1.5 | G8-2,90:2:6.5:1.5 | ~1.9-fold lung expression |
| Phospholipid | POPE,8.5 mol% | DSPC,8.5 mol% | ~1.7-fold lung expression |
| N/P | 10 | 5/10/15/20 | Author-selected condition; no exact fold assigned |
| Buffer | B6,20 mM acetate,pH4 | B1,10 mM citrate,pH3 | ~8-fold lung expression |
Source: Figs.1–3; SI S2–S8.
The authors describe an overall improvement exceeding 100-fold versus initial G4 after sequential optimization. This is not a comparison between two chemical identities, and stage-specific fold changes are not multiplied here. The N/P plot does not establish a statistically unique global optimum; 10 is the condition adopted by the authors.
Initial G1–G9 composition screen
| Group | Lipid-392 | DSPC | Cholesterol | DMG-PEG2000 | Sum mol% |
|---|---|---|---|---|---|
| G1 | 0 | 14.1 | 54.4 | 1.5 | 70.0 |
| G2 | 30 | 14.1 | 54.4 | 1.5 | 100.0 |
| G3 | 40 | 12.1 | 46.4 | 1.5 | 100.0 |
| G4 | 50 | 10 | 38.5 | 1.5 | 100.0 |
| G5 | 60 | 7.9 | 30.6 | 1.5 | 100.0 |
| G6 | 70 | 5.9 | 22.6 | 1.5 | 100.0 |
| G7 | 80 | 3.8 | 14.7 | 1.5 | 100.0 |
| G8 | 90 | 1.8 | 6.7 | 1.5 | 100.0 |
| G9 | 100 | 0 | 0 | 0 | 100 |
Source: Fig.1B.
G1 sums to 70 mol% as printed; its missing fraction is not inferred. G9 has 0% PEG in the figure despite the general fixed-PEG statement. These source entries are retained for traceability and are not used as calculated preparation recipes.
G8 helper-lipid screen
| Group | Lipid-392 | DSPC | Cholesterol | DMG-PEG2000 | N/P |
|---|---|---|---|---|---|
| G8-1 | 90 | 0 | 8.5 | 1.5 | 12 |
| G8-2 | 90 | 2 | 6.5 | 1.5 | 12 |
| G8-3 | 90 | 4 | 4.5 | 1.5 | 12 |
| G8-4 | 90 | 6 | 2.5 | 1.5 | 12 |
| G8-5 | 90 | 8.5 | 0 | 1.5 | 12 |
Source: SI Fig.S4A.
Buffer screen
| Group | Buffer | Concentration | pH |
|---|---|---|---|
| B1 | Citrate | 10 mM | 3.0 |
| B2 | Citrate | 20 mM | 3.0 |
| B3 | Citrate | 10 mM | 4.0 |
| B4 | Citrate | 20 mM | 4.0 |
| B5 | Acetate | 10 mM | 4.0 |
| B6 | Acetate | 20 mM | 4.0 |
Source: Fig.3A; buffer reporter comparison n=2.
Experiment-specific performance
| Endpoint | Finding | Experimental context / comparator | Source |
|---|---|---|---|
| Initial formulation screen | G8 (90 mol% Lipid-392) gave approximately 12-fold higher lung expression than G4 (50 mol%). | Luc mRNA 0.1 mg/kg IV; C57BL/6 mice; 6 h; n=3; N/P 12; comparator: Matched G1–G9 formulation series | Fig. 1B–F; SI S2 |
| Cholesterol removal | G8-5 (90:8.5:0:1.5) gave approximately 1.9-fold higher expression than G8-2 (90:2:6.5:1.5). | Mouse IV luciferase screen; dose/time not separately restated in Fig.2 caption; n=3; Lipid-392/DSPC/cholesterol/DMG-PEG2000; N/P 12; comparator: G8-1 through G8-5 | Fig. 2A–B; SI S4 |
| Phospholipid selection | POPE gave the greatest reported expression, approximately 1.7-fold versus DSPC. | Mouse IV luciferase screen; dose/time not separately restated in Fig.2 caption; n=3; Lipid-392/helper/DMG-PEG2000 90:8.5:1.5; N/P 12; comparator: DSPC, DOPC, 4ME, DOPE, POPE | Fig. 2C–D; SI S5 |
| N/P selection | Authors selected N/P 10 for the POPE-containing three-component formulation. | Mouse IV luciferase screen; dose/time not separately restated in Fig.2 caption; n=3; comparator: N/P 5, 10, 15, 20 | Fig. 2E–F; SI S6 |
| Buffer selection | B6 (20 mM acetate pH 4.0) produced approximately 8-fold higher lung expression than B1 (10 mM citrate pH 3.0). | Lipid-392 stLNP; IV luciferase screen; n=2; exact screen dose not restated in Fig. 3A–C caption; comparator: Six buffer conditions B1–B6 | Fig. 3A–C; SI S8 |
| Matched lung benchmark | 4.93-fold higher lung luciferase signal; approximately 99% of measured lung/liver/spleen signal localized to lung. | Luc mRNA 0.25 mg/kg IV; 6 h; n=4; comparator: DOTAP-5-LNP | Fig. 3F–G; Results p.15353 |
| RNA-loaded acute tolerability | Displayed ALT/AST and inflammatory markers were comparable to PBS; DOTAP-5-LNP elevated multiple markers. | Luc mRNA 1 mg/kg IV; 6, 24, 48 h; n=5; comparator: PBS and DOTAP-5-LNP | Fig. 3H; SI S12 |
| High-dose empty particles | Transient liver-enzyme/cytokine elevations; highest-dose markers remained mildly elevated at 48 h. No overt distress or organ damage reported over the observation period. | EMPTY stLNP; lipid exposure equivalent to RNA doses 5, 8, 10, 12 mg/kg; IV; 6, 24, 48 h; n=3; comparator: PBS | Fig. 2G–H; SI S7; Results p.15351 |
| Lung-cell uptake | Cy5-positive: approximately 82% endothelial, 78% epithelial and 50% total lung cells. This is uptake, not editing. | Cy5-labeled mRNA; IV; 6 h; n=3; dose CONFLICT: 0.3 mg/kg in Fig. 4A caption, 0.5 mg/kg in Results/Methods; comparator: PBS | Fig. 4A–D; SI S13; Methods p.15358 |
| Cre reporter activation | tdTomato-positive: approximately 68% endothelial, 70% epithelial, 32% immune and 37% total lung cells. | Ai14 mice; Cre mRNA IV; 48 h; n=3; dose CONFLICT: 0.5 mg/kg in Fig. 4E caption, 0.3 mg/kg in Results/Methods; comparator: PBS | Fig. 4E–H; Methods p.15358 |
| Single-dose kinetics | Luciferase signal detectable from 0.5 h to 48 h; the 48 h image uses a different color scale. | Luc mRNA 0.75 mg/kg IV; 0.5, 2, 6, 12, 24, 48 h; n=4; comparator: Within-formulation time course | Fig. 5A–C |
| Repeat dosing | Similar expression peaks were obtained after dosing every 48 h over three administrations. | Luc mRNA 0.75 mg/kg IV at 0, 48, 96 h; follow-up through 144 h; n=4; comparator: Repeated stLNP administration | Fig. 5A/D–E |
| Adenine base editing | 3.24% editing in lung tissue by NGS; separate from the much larger Cre reporter percentages. | ABE reporter mice; ABE mRNA:sgRNA 2:1 mass ratio; total RNA 1 mg/kg IV; day 5; n=3; comparator: PBS | Fig. 5F–H; Methods p.15358 |
| Acute lung injury treatment | IL-10 delivery reduced TNF-alpha and IL-6 in lung tissue and BALF and improved histology. Empty LNP did not produce the same effect. | LPS-induced mouse ALI; IL-10 mRNA 1 mg/kg IV 2 h after induction; n=4; LPS dose and endpoint timing conflict between Results and Methods; comparator: Healthy, LPS/PBS, LPS/empty LNP | Fig. 5I–K; SI S15–S16; Methods p.15358 |
| siTie2 knockdown | Lung Tie2 mRNA ED50 = 0.056 mg/kg; protein suppression also evaluated. | Single IV siTie2 dose-response; lung tissue at 72 h; n=3; exact dose range differs between plotted series and Methods list; comparator: PBS / dose-response | Fig. 6A–C; Methods p.15359 |
| siEGFP knockdown | Approximately 50% lung EGFP mRNA knockdown with reduced reporter fluorescence. | EGFP reporter mice; IV; day 3; n=3; dose CONFLICT: 1 mg/kg in Fig. 6D caption, 2 mg/kg in Methods; comparator: LNP-only control | Fig. 6D–F; Methods p.15359 |
| Particle characterization | Apparent LNP pKa 7.67 by TNS; spherical particles below 100 nm by cryo-TEM. No exact DLS mean assigned from a plotted bar. | Final stLNP; TNS half-maximal fitted fluorescence, pH 2.5–11; n=3; comparator: No isolated-lipid pKa measurement | Fig. 3D–E |
| Short-term physical stability | Main text describes one-week stability; SI S9 plots observations through day 9. No validated shelf life or storage temperature assigned. | Size, PDI and encapsulation monitored; n=3; comparator: Within-formulation time course | SI S9; Results p.15353 |
Benchmark and dose interpretation
DOTAP-5-LNP was MC3/DSPC/cholesterol/DMG-PEG2000/DOTAP = 25:5:19.3:0.8:50 as printed (sum 100.1 from rounding). It is a separate five-component comparator. The 4.93-fold result is a matched 0.25 mg/kg reporter experiment; acute safety was compared at 1 mg/kg RNA. The 12 mg/kg result uses empty particles at an RNA-equivalent lipid exposure, not demonstrated delivery of 12 mg/kg RNA without toxicity.
Approximately 99% refers to the relative reporter signal among the measured organs, not 99% of injected dose, 99% of all lung cells, or 99% editing. Uptake, Cre reporter activation, ABE editing and siRNA knockdown are distinct endpoints.
Structure and analytical identity
| Item | Evidence |
|---|---|
| Structure mapping | SI Fig.S1 labels the final structure NNCC14; the figure caption and synthesis identify it as Lipid-392. NNCC14 is retained as a source-scheme alias. |
| Architecture | N-methylbis(3-aminopropyl)amine-derived scaffold, three tertiary amines, three palmitoyl diacylhydrazide branches and one N-linked 2-hydroxydecyl arm. No ester linker is present. |
| Formula | C74H147N9O7; explicitly reported and independently recovered from the depicted neutral structure. |
| Average molecular weight | 1275.05; calculated from the verified neutral structure. |
| Salt / stereochemistry | No isolated counterion or solvate assigned. The OH-bearing stereocenter is unspecified; no enantiopurity claim. |
| HRMS discrepancy | SI reports [M+H]+ calculated 1275.15 and found 1275.1793. Toolkit theoretical value is 1275.1496; the approximately 23 ppm offset is unresolved without the raw spectrum. |
| Analytical record | SI p.3 supplies 1H NMR shifts and ELSD-HPLC 96.30% for the research batch. This is not a certificate for a DC Chemicals lot. |
| Derived SMILES | CCCCCCCCCCCCCCCC(=O)NNC(=O)CCN(CCCN(C)CCCN(CCC(=O)NNC(=O)CCCCCCCCCCCCCCC)CC(O)CCCCCCCC)CCC(=O)NNC(=O)CCCCCCCCCCCCCCC |
Source: SI Fig.S1 pp.2–3; main Fig.1A.
Synthesis and structural interpretation
The reported route prepares palmitoyl hydrazide from methyl palmitate, installs an acryloyl group to form M-2, and opens 1,2-epoxydecane with N-methylbis(3-aminopropyl)amine to form M-3. Three aza-Michael additions of M-2 onto M-3 give Lipid-392; the final step reports 37.8% isolated yield. The M-3 text name contains a diol wording inconsistency; the scheme and formula show one alcohol.
Observed formulation relationship: raising Lipid-392 content, removing cholesterol, selecting POPE and optimizing the aqueous buffer improved lung reporter expression in the tested series. This work does not isolate headgroup, chain-length or linker SAR using matched molecular analogues.
Design hypothesis: the hydrazide linkers may influence adsorbed protein corona and pulmonary distribution; this is proposed rather than directly established. Priorities for future matched studies include hydrazide-linker substitution, acyl-chain length and the hydroxyl-bearing arm, while keeping formulation and dose fixed.
Source discrepancies and limits
| Issue | How it is handled |
|---|---|
| 1 | Published HRMS [M+H]+ calculated 1275.15, found 1275.1793; toolkit theoretical 1275.1496. The approximately 23 ppm difference remains unresolved without the raw spectrum. Depicted connectivity, route and reported neutral formula agree. |
| 2 | Fig. 4 Cy5-mRNA dose 0.3 mg/kg versus Results/Methods 0.5 mg/kg; Cre dose 0.5 mg/kg versus Results/Methods 0.3 mg/kg. Do not silently swap these. |
| 3 | ALI LPS induction: Results 2 mg/kg versus Methods 10 micrograms/mouse; endpoint 24 h after treatment versus 24 h after induction. Not presented as a fully resolved reproduction protocol. |
| 4 | siEGFP dose: Fig. 6D 1 mg/kg versus Methods 2 mg/kg. siTie2 Methods dose list omits lower plotted doses. |
| 5 | Initial G1 recipe sums to 70 mol% as printed. G9 has zero PEG despite the general fixed-PEG description. Neither is corrected by inference. |
| 6 | DOTAP-5-LNP printed ratio sums to 100.1 because of rounding. No silently normalized mass recipe supplied. |
| 7 | N/P definition does not unambiguously specify which lipid nitrogens are counted. No RNA mass-to-lipid conversion is supplied. |
| 8 | No CAS, assigned stereochemistry, isolated counterion, commercial lipid pack prices, batch COA or raw spectral/source-data files supplied. |
| 9 | S9 does not establish a neat-material or stock-solution shelf life; main text one week versus plot through day 9. |
| 10 | Lipid-392 is the investigated lipid; G1–G9 and B1–B6 are formulations of that lipid, not different chemical compounds. |
References
Fei Y, Lin Y, Liu P, Zhong K, Gao Y, Ma Q, Zhou Z, Luo S, Hu R, Cheng Q. Optimization of Lipid Nanoparticles for Safe and Versatile Lung-Targeted RNA Delivery and Disease Therapy. ACS Nano. 2026;20:15347–15362. doi:10.1021/acsnano.6c03013. Original article and Supporting Information.
Main article: Figs.1–6 and Methods pp.15357–15359. Supporting Information: Fig.S1 and synthesis pp.2–3, Figs.S2–S16 and Tables S1–S4. The supplied full article and SI were inspected; separate raw source data and raw analytical spectra were not supplied.