E10i-494
DC13101
Recommended because it shares a closely related research category or delivery context. Formulation and performance are product- and study-specific.
View product →
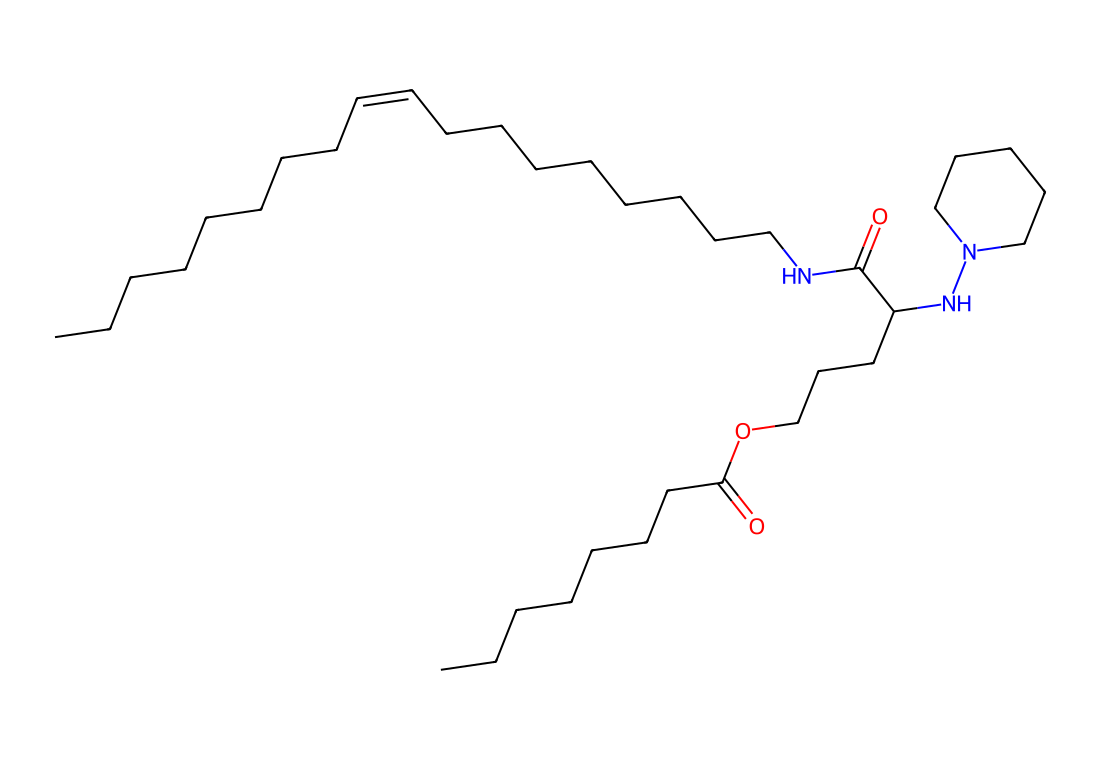
Lipid H9 is an ionizable lipid identified with the AGILE platform for mRNA delivery research. In the cited study, optimized H9 lipid nanoparticles delivered firefly-luciferase mRNA to mouse muscle after intramuscular injection, with a 7.8-fold higher local expression signal than the MC3 benchmark and a signal comparable to ALC-0315. The investigators also evaluated Cre mRNA delivery and an ovalbumin mRNA vaccination model.
| CAS No. | Not available |
| Chemical Name | (Z)-5-(octadec-9-en-1-ylamino)-5-oxo-4-(piperidin-1-ylamino)pentyl octanoate |
| Synonyms | Lipid-H9 |
| SMILES | CCCCCCCC/C=C\CCCCCCCCNC(=O)C(CCCOC(=O)CCCCCCC)NN1CCCCC1 |
| Formula | C36H69N3O3 |
| M.Wt | 591.97 |
| Purity | >95% by ELSD-HPLC |
| Storage | Pure form: −20 °C, 1 year; In solvent: −80 °C, 6 months; −20 °C, 1 month. Sealed and protected from light. |
| Shipping condition | Ships from Shanghai. Pure lipid is stable during ice-pack transport. |
| Publication | Xu Y, et al. Nature Communications 15, 6305 (2024). DOI: 10.1038/s41467-024-50619-z |
| Component | mol% | Role |
|---|---|---|
| H9 | 50 | Ionizable lipid |
| DOPE | 10 | Helper phospholipid |
| Cholesterol | 38.5 | Sterol |
| DMG-PEG2000 | 1.5 | PEG lipid |
| Total | 100 | Top-performing H9 formulation in the Methods section |
In the mTmG reporter model, intramuscular H9 LNPs carrying Cre mRNA produced muscle GFP expression comparable to ALC-0315, with lower liver expression. In the separate mOVA prime-boost vaccination experiment, anti-OVA IgG was comparable to ALC-0315 and serum ALT/AST levels were lower (Supplementary Figs. S15 and S17).
Original publication figures illustrating the cited formulation and biological results. Select an image to view it at full size.
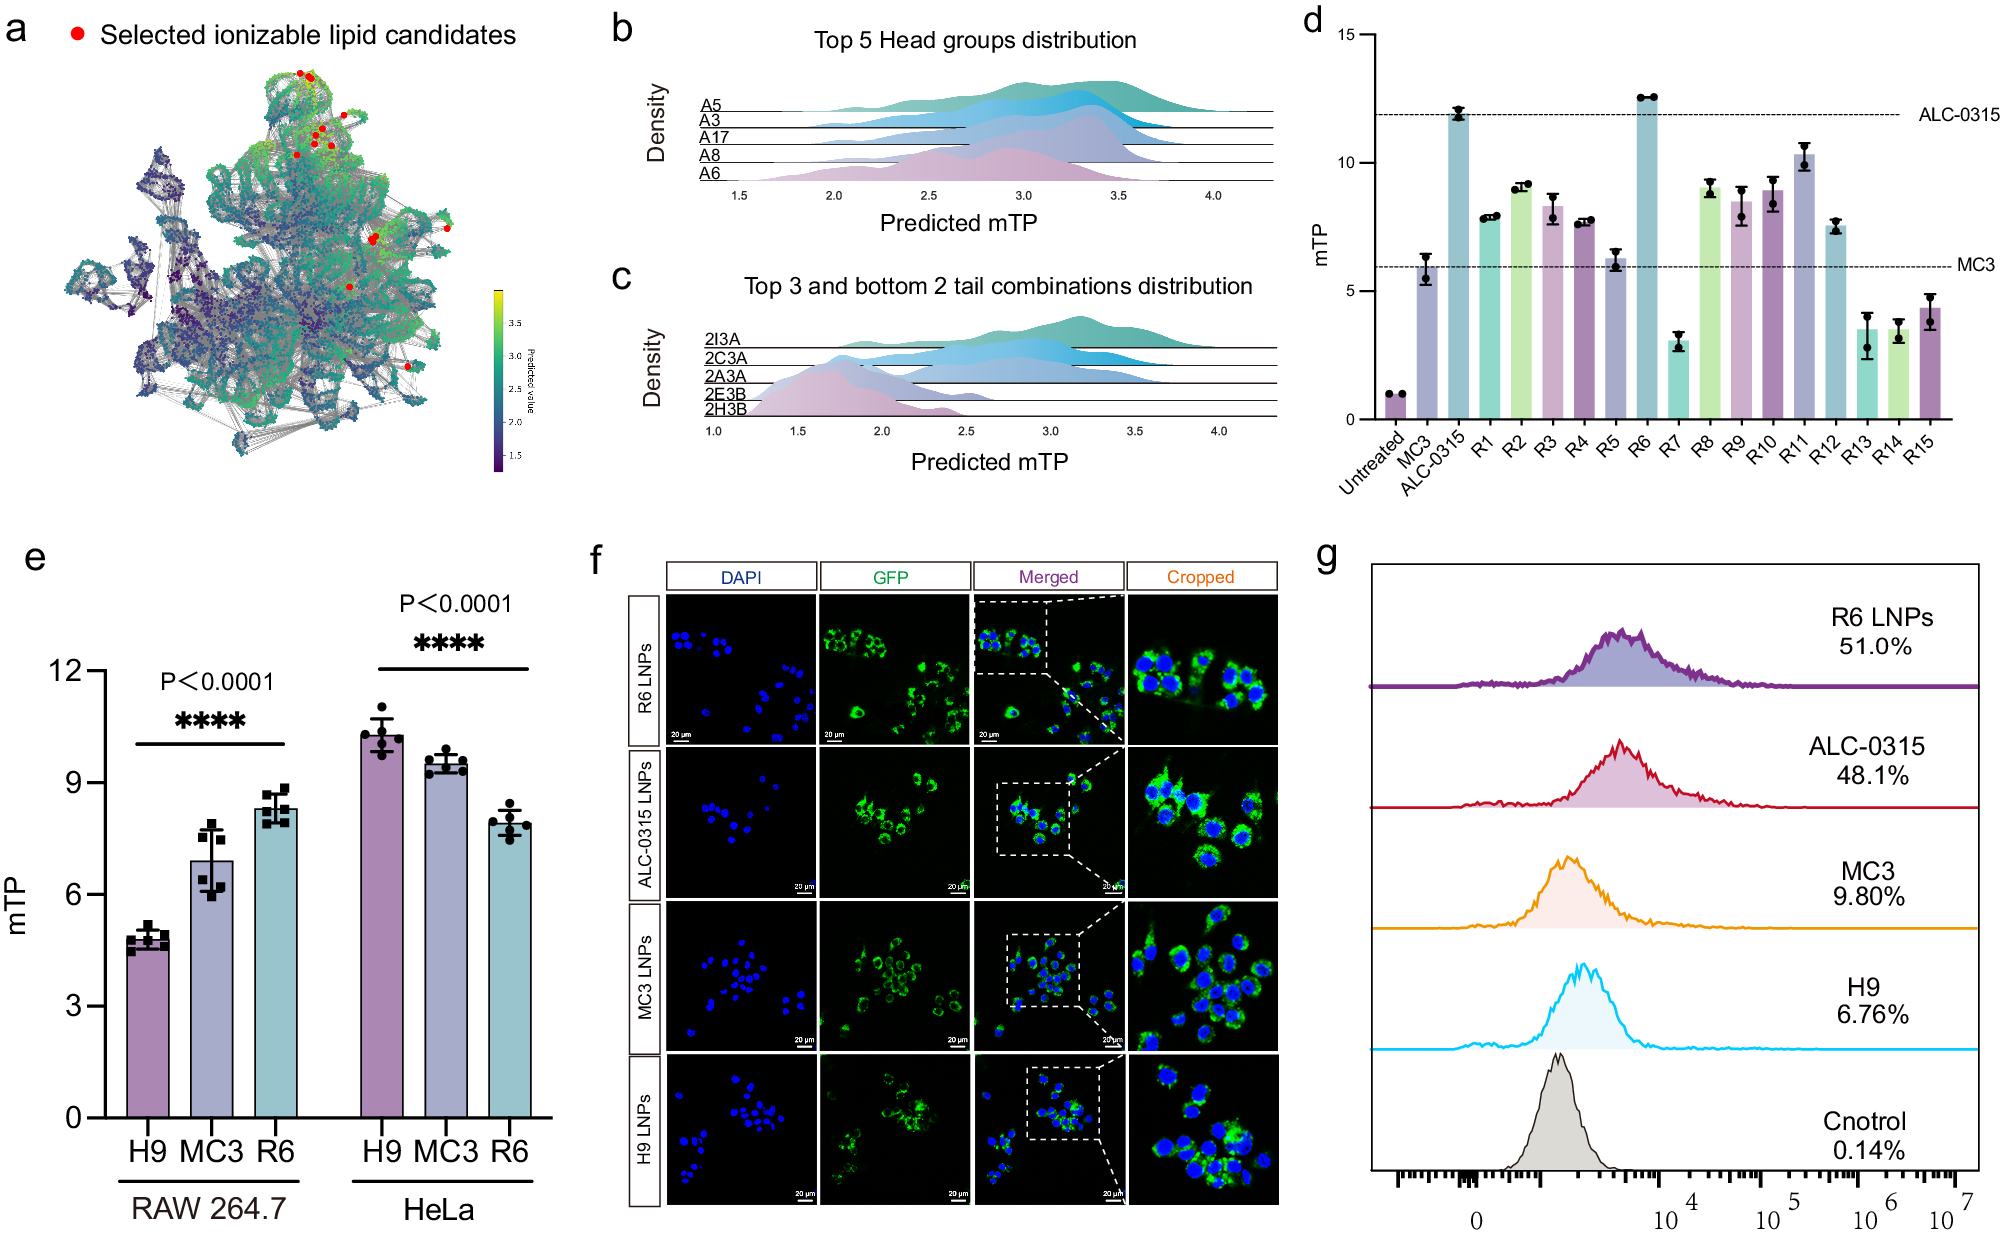
R6, H9 and benchmark LNPs are compared in RAW 264.7 and HeLa cells. Panels e–g show measured reporter expression, microscopy and flow cytometry; panels a–c show model predictions, not experimental efficacy. RAW 264.7 macrophages and HeLa cells; eGFP mRNA; n=6 for panel e and n=3 for microscopy; 20 µm scale bars.
Xu et al. (2024), Nature Communications, Figure 4. CC BY 4.0. Original figure unchanged. Original article / figure · CC BY 4.0. Unmodified complete original figure; displayed at responsive size.
The product molecular weight is prefilled when available and remains editable. Confirm solvent compatibility and solubility before preparation.
Solvent volumes update from the molecular weight above.
| Mass | 1 mM | 5 mM | 10 mM |
|---|---|---|---|
| 10 mg | 16.8927 mL | 3.3785 mL | 1.6893 mL |
| 25 mg | 42.2319 mL | 8.4464 mL | 4.2232 mL |
| 50 mg | 84.4637 mL | 16.8927 mL | 8.4464 mL |
| 100 mg | 168.9275 mL | 33.7855 mL | 16.8927 mL |
| 250 mg | 422.3187 mL | 84.4637 mL | 42.2319 mL |
Contact our team with the catalog number and requested quantity.