
| Parameter | Value |
|---|---|
| Catalog number | DCL0016 |
| Product name | U-510 |
| Aliases | U510; U 510; Janus lipid U-510 |
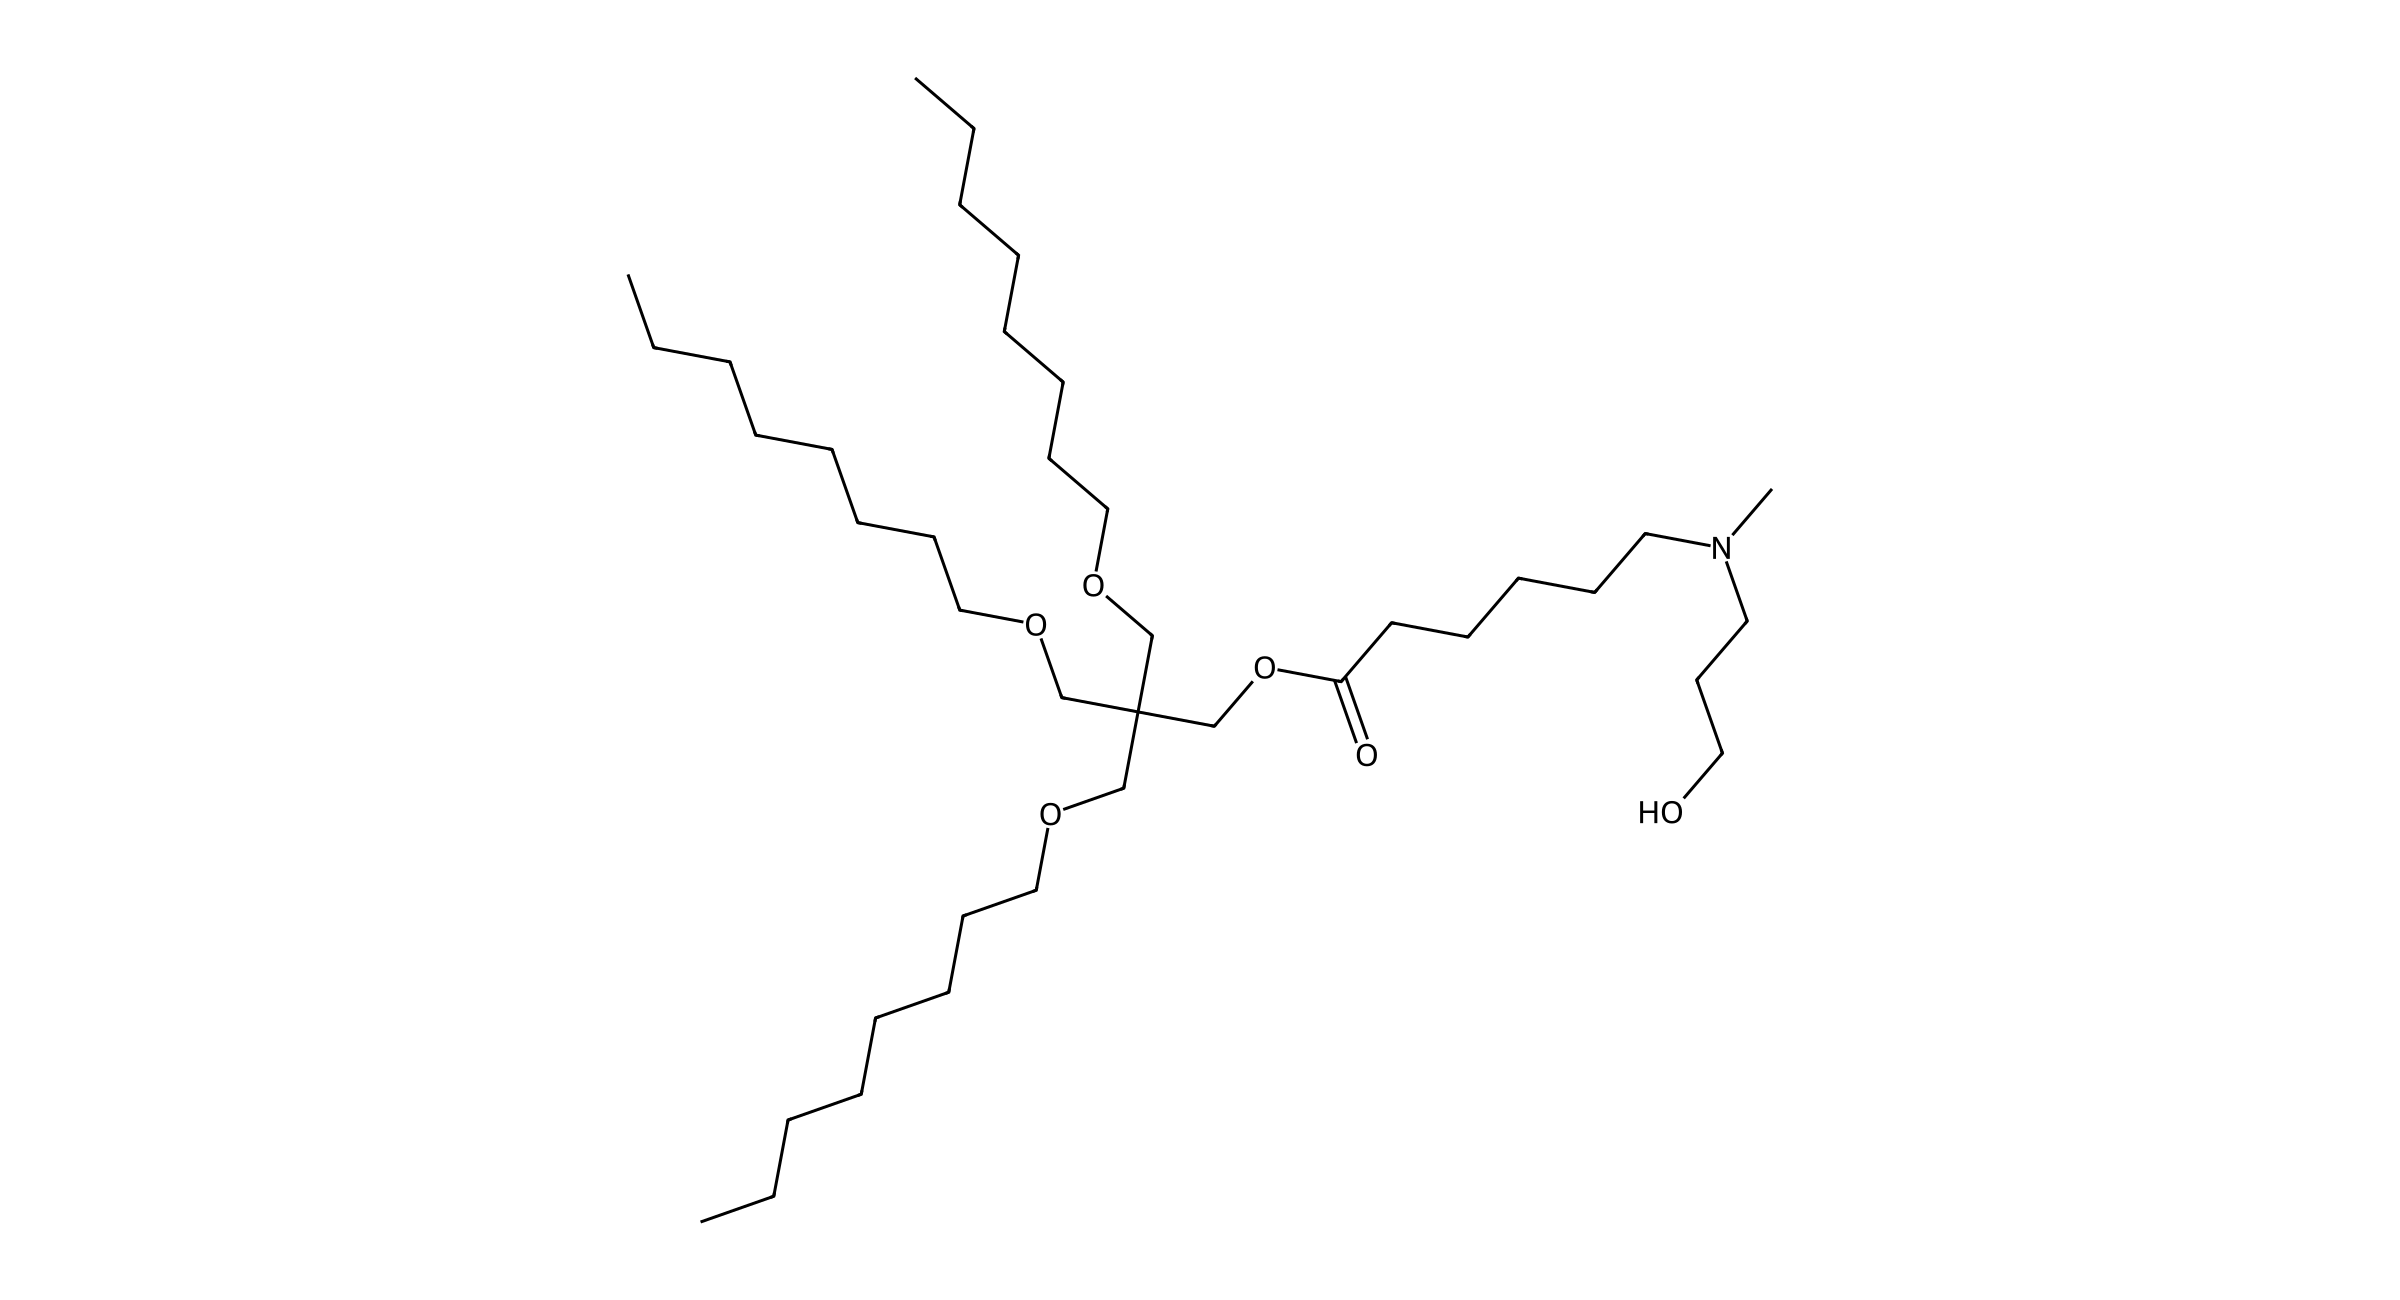
| Molecular formula | C39H79NO6 |
| Molecular weight | 658.06 g/mol |
| SMILES | CCCCCCCCOCC(COCCCCCCCC)(COCCCCCCCC)COC(=O)CCCCCN(C)CCCO |
| Purity / availability | >95% by ELSD-HPLC |
| CAS No. | Not available |
| Form | Neutral parent; no counterion or solvate depicted |
| Storage | Unopened pure lipid: −20 °C, up to 1 year. Follow the batch expiry / retest date. |
1. Selection and comparison
Primary expression endpoint: luciferase signal in 6–8-week-old BALB/c mice, IV, 0.5 mg/kg Fluc mRNA, 3 h, n = 3. U-502 and U-503 are the co-leading expression candidates. U-510 is selected for its organ-expression profile, not the highest total output. U-502 is prioritized for the breadth of follow-up evidence; the study does not establish a significant difference between U-502 and U-503.
| Candidate | Selection rationale | Matched in vivo result | Structural distinction | Additional evidence |
|---|---|---|---|---|
| U-502 · DCL0014 | Co-leading systemic expression; numerically slightly higher than U-503 in Fig. 2f | Modestly above ALC-0315; bracket *P < 0.05 | Six C8 tails; two tertiary amines / two hydroxyls | Representative H&E and cell delivery panels included |
| U-503 · DCL0015 | Co-leading systemic expression | Modestly above ALC-0315; bracket *P < 0.05 | Six C10 tails; same head as U-502 | Serum / CCK-8 series included; no product-specific H&E or eGFP panel |
| U-510 · DCL0016 | Spleen-expression selectivity candidate | Author-reported 52% spleen targeting in organ-radiance comparison; lower total expression than Group 1 | Three C8 tails; one tertiary amine / one hydroxyl | Serum / CCK-8 series included; no product-specific H&E or eGFP panel |
| U-509 | Alternative splenic-expression candidate | Higher absolute spleen radiance than U-510 in Fig. 2g; liver radiance also higher | Three C6 tails; same head as U-510 | Not selected for the first release; distinct absolute-output endpoint |
| U-506 | Useful headgroup comparator | Below ALC-0315 in the reported IV screen | Six C8 tails; one tertiary amine / one hydroxyl | Representative H&E and cell delivery panels included |
Source: Main §§2.9, 3.3–3.5; Fig. 2 pp. 5–7.
2. Formulation and component mass table
Standardized order: U-510 / DSPC / cholesterol / DMG-PEG2000 = 50:10:38.5:1.5 mol%. This is the same composition as the source’s ionizable lipid / cholesterol / DSPC / DMG-PEG2000 order. Total = 100 mol%.
| Component | Company product | MW (g/mol) | mol% | Mass at 10 µmol total (mg) | Mass fraction (%) |
|---|---|---|---|---|---|
| U-510 | DCL0016 | 658.06 | 50 | 3.2903 | 55.34 |
| DSPC | DC57005 | 790.15 | 10 | 0.7902 | 13.29 |
| Cholesterol | DCD-041.html | 386.65 | 38.5 | 1.4886 | 25.04 |
| DMG-PEG2000 | DC40169 | 2507.00 | 1.5 | 0.3760 | 6.33 |
Calculated planning quantities. DMG-PEG2000 uses the agreed catalog MW of 2507 g/mol. These component masses are derived from the stated molar composition; the inconsistent source stock concentrations are not used.
| Component | MW (g/mol) | mol% | µmol | mg | Mass % |
|---|
Enable JavaScript for the interactive calculator; the static 10 µmol calculation appears above.
mg = total µmol × mol% ÷ 100 × MW ÷ 1000. RNA quantity, N/P, solvent volume and process loss are not inferred.
Source: Main §2.3 p. 2; component MWs are product/structure calculation inputs.
3. Preparation and reproducibility
| Parameter | Reported method |
|---|---|
| Organic phase | Four lipid components in anhydrous ethanol, dissolved by ultrasound; 150 µL organic aliquot used. |
| Aqueous phase | 50 µg mRNA from a 10 µg/µL stock added to 450 µL citrate buffer, pH 4; 450 µL aqueous aliquot described. Citrate concentration not specified. |
| Mixing | Laboratory-built microfluidic mixer; stated aliquots 150 µL ethanol phase and 450 µL aqueous phase (1:3 by volume). Flow rates not disclosed. |
| Purification | Add mixed product to 10 mL PBS; concentrate with 100 kDa MWCO ultrafiltration tube at 5000 rpm to approximately 500 µL. |
| Final filtration | 220 nm membrane filter. |
| N/P and lipid:RNA mass ratio | Not reported. Do not derive a definitive value from the conflicting stock concentrations. |
| RNA preparation | T7 in vitro transcription followed by capping and purification; modified-nucleoside chemistry is not specified. |
Source: Main §§2.2–2.3 p. 2.
Concentration discrepancy: the method lists ionizable lipid / cholesterol / DSPC / DMG-PEG2000 concentrations of 20 / 1.54 / 4 / 0.6 mM, inconsistent with the stated molar ratio. The 50:38.5:10:1.5 ratio is retained as reported; the stock recipe needs clarification before reproduction.
4. Formulated-particle properties
| LNP | Size (nm) | PDI | Apparent pKa | Encapsulation (%) |
|---|---|---|---|---|
| U-510 | 113 | 0.146 | 6.38 | 87.88 |
| ALC-0315 benchmark | 119 | 0.137 | 6.30 | 90.02 |
SI Table S1 gives single summary values without uncertainty or replicate counts. Size/PDI: DLS; encapsulation: RiboGreen. Apparent LNP pKa: TNS fluorescence at half-maximal signal, using 150 mM NaCl and 10 mM each sodium borate, citrate and phosphate. No numerical zeta potential is reported.
Source: SI Table S1; Main §§2.4 and 2.6 pp. 2–3.
5. In vivo mRNA delivery
The authors report 52% spleen-targeting efficiency for U-510 in the context of comparing liver and spleen radiance (Fig. 2g; §3.3). The denominator is not explicitly defined. This number is not a percentage of transfected spleen cells, RNA uptake or injected dose.
U-509 has higher absolute spleen radiance in the same panel; U-510 is emphasized for its relative organ-expression profile. Both have lower total expression than the six-tail Group 1 leads. No splenic cell subtype or receptor-targeting mechanism was established.
| Cargo | Model | Route | Dose | Time | Replication |
|---|---|---|---|---|---|
| Fluc mRNA | BALB/c mice, 6–8 weeks | Intravenous | 0.5 mg/kg mRNA | 3 h | n = 3 |
Source: Main §2.9 p. 3; Fig. 2 p. 5; §3.3 pp. 6–7.
6. Cell delivery and mechanism
U-510 was not one of the representative eGFP transfection or lysosomal-colocalization samples in Fig. 4a,b. Those panels examine U-502, U-506 and U-511; their numerical cell-delivery results are not assigned to U-510.
Source: Main §§2.5, 2.8 and 3.5; Fig. 4 p. 7.
7. Tolerability
All 16 formulations were included in the serum cytokine and liver/kidney-marker panels: IV 0.5 mg/kg, serum collected at 6 h; n = 3. The authors report values similar to ALC-0315. These are acute comparative observations, not a long-term safety evaluation.
CCK-8 testing covered HEK293 and DC2.4 cells using 1 µg mRNA per well and a 24-hour exposure. Fig. 4c is presented as a viability assessment, but its y-axis is labeled “Concentration (IU/L)”; exact viability percentages are not assigned from that inconsistent axis.
The representative H&E panel does not include U-510; the histology results for U-502, U-506 and U-511 are not transferred to this product.
Source: Main §2.10 p. 3; Fig. 3 p. 6; Fig. 4c and §3.4 p. 7.
8. Structure and observed SAR
U-510 contains 1 tertiary amine(s), 1 hydroxyl group(s), 1 ester linker(s), and 3 C8 ether-linked tails. The ether tail linkages and ester core connections are distinguished; a measured degradation half-life is not reported.
Observed SAR: Group 1 C8 and C10 tails (U-502/U-503) outperform its C6 and C12 analogues under the IV screen. Across groups, both head structure and tail count change, so their causal effects cannot be isolated. Group 3 shows a different liver/spleen expression profile.
Design hypotheses: tail length, dendron number and headgroup hydroxyl/amine balance are useful variables for further matched comparisons. Improved membrane fusion or protonation from six tails is a proposed explanation, not independently proven by this screen.
Source: Main Scheme 1 p. 3; Fig. 2 pp. 5–7; SI Figs S28–S30 pp18–19.
9. Source discrepancies and missing data
| Issue | Interpretation |
|---|---|
| Organic concentrations | The stated component order is ionizable lipid / cholesterol / DSPC / DMG-PEG2000 = 50:38.5:10:1.5 mol%. The listed concentrations 20 / 1.54 / 4 / 0.6 mM do not reproduce that ratio. The cholesterol value is not silently changed to 15.4 mM. |
| RNA phase volume | The method adds 50 µg RNA from a 10 µg/µL stock to 450 µL citrate buffer, then withdraws 450 µL of aqueous solution. Whether 450 µL is buffer or final volume is not fully resolved. |
| Missing process parameters | N/P, total lipid:RNA mass ratio, citrate molarity, total microfluidic flow rate and individual flow rates are not reported. |
| Source labels | Fig. 2g caption calls the subgroup “fourth group”, while the plotted labels are U-509–U-512 (Group 3). SI synthesis paragraphs contain copied compound-number errors; Scheme 1 and labeled analytical figures establish the identities. |
| Mass-spectrometry discrepancies | SI captions mix calculated masses with m/z and contain inconsistent values. U-502 Fig. S6 caption says found 1130.034, while embedded spectrum text says 1300.0340. The supplied peak values do not accurately match calculated [M+H]+ for the depicted structures. No exact-mass agreement or analytical validation is claimed. |
| Interpretation | Short mouse studies and cell assays do not establish human safety, long-term tolerability or receptor-mediated targeting. Apparent LNP pKa is not the intrinsic pKa of the isolated molecule. |
10. References and evidence
Liu C, Jiang Y, Xue W, Liu J, Wang Z, Li X. Janus dendritic ionizable lipids with fine designed headgroup and tails to improve mRNA delivery efficiency. Bioorganic & Medicinal Chemistry. 2025;120:118080. doi:10.1016/j.bmc.2025.118080. Main article: 8 pages. Supporting Information: synthesis, Figs. S1–S50 and Table S1.
Values shown are literature-reported results for the cited formulation and study conditions. They do not guarantee performance of the supplied product in other formulations or experiments.