
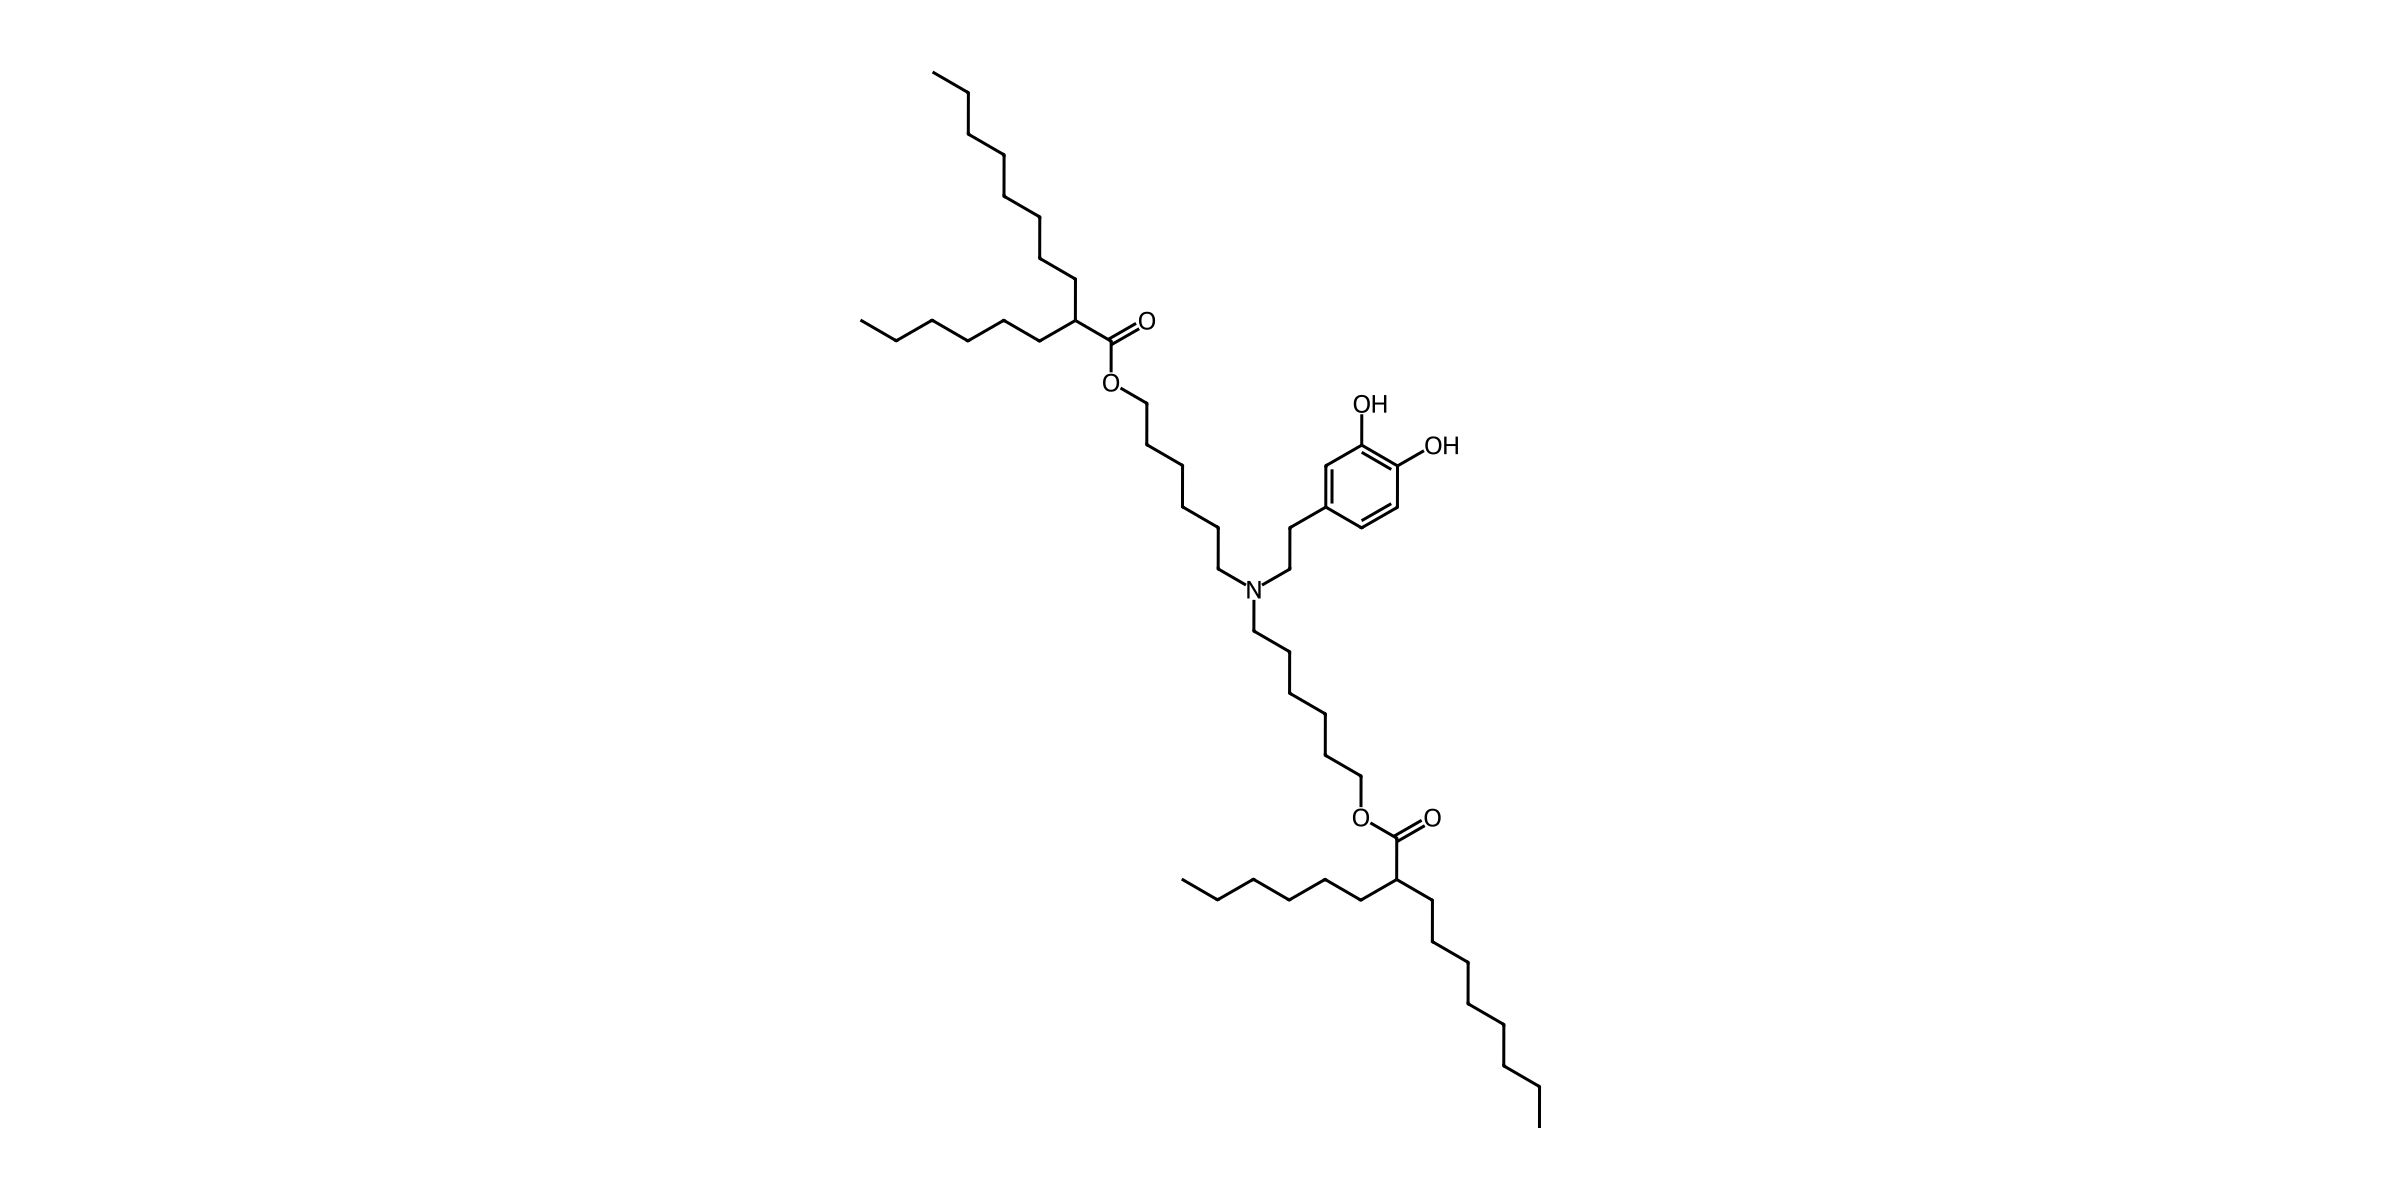
| Parameter | Value |
|---|---|
| Chemical Name | DA lipid |
| CAS No. | Not available |
| Synonyms | Dopamine-derived ionizable lipid; Dopamine lipid; DA ionizable lipid |
| Formula | C52H95NO6 |
| M.Wt | 830.33 |
| SMILES | CCCCCCCCC(CCCCCC)C(=O)OCCCCCCN(CCCCCCOC(=O)C(CCCCCC)CCCCCCCC)CCc1ccc(O)c(O)c1 |
| Purity | >95% by ELSD-HPLC |
| Storage | −20 °C; unopened, protected from light and moisture. Up to 1 year under the standard catalog guidance; follow the batch expiry/retest date. |
Study lead and matched comparison
| Candidate | Role | Conclusion |
|---|---|---|
| DA lipid | Selected antioxidant lead | Higher ROS scavenging and expression than oxidized ODA; comparable reporter expression and prophylactic tumor suppression to ALC-0315. |
| ODA lipid | Oxidized catechol/quinone control | Lower antioxidant activity and expression than DA under matched study conditions. |
| ALC-0315 | Benchmark | Comparable expression and preventive antitumor response; DA is not established as globally superior. |
Reported formulation
DA lipid / DSPC / cholesterol / DMG-PEG = 50:10:38.5:1.5 mol%.
| Parameter | Reported condition |
|---|---|
| Organic phase | Four lipids dissolved in ethanol |
| Aqueous phase | mRNA in 10 mM citrate buffer, pH 3 |
| Mixing ratio | Aqueous:ethanol = 3:1 v/v |
| Post-processing | Dialysis against PBS for 2 h |
| Total lipid:mRNA | 20:1; the source does not explicitly state the mass/molar basis |
| N/P | Not reported |
| Flow rates / mixer | Not specified |
| LNP characterization | DA shows a smaller DLS distribution than ODA and ALC-0315; precise mean size, PDI and encapsulation percentage are not tabulated. |
| Apparent pKa | Reported range 6.0–7.0; TNS titration; not an intrinsic molecular pKa |
Source: Main §§2.1, 4.2–4.4; SI Figs. S10–S14.
Component molecular weights and calculated mass proportions
Planning adaptation: the original paper specifies DMG-PEG without its PEG grade. The following calculation uses our DMG-PEG2000 catalog MW of 2507. It is not an exact reproduction claim for the source reagent.
| Component | MW | mol% | Mass for 10 µmol total (mg) | Mass fraction (%) |
|---|---|---|---|---|
| DA lipid | 830.33 | 50 | 4.1517 | 61.00 |
| DSPC | 790.15 | 10 | 0.7902 | 11.61 |
| Cholesterol | 386.65 | 38.5 | 1.4886 | 21.87 |
| DMG-PEG2000 | 2507 | 1.5 | 0.3760 | 5.52 |
Total calculated lipid mass: 6.8065 mg per 10 µmol. mg = total µmol × mol fraction × MW ÷ 1000. No RNA dose or N/P is derived.
Experimental findings
| Endpoint | Finding | Conditions and interpretation | Source |
|---|---|---|---|
| Antioxidant activity | DA exceeded ODA in ABTS and superoxide-scavenging assays; concentration-dependent response. | DA versus oxidized ODA; n=4 in main antioxidant assays. | Main Fig. 1a–b; SI Fig. S15 |
| Intracellular ROS | Lower DCFH-DA-associated signal with DA LNPs than ODA LNPs. | DC2.4, 6 h; n=4. DCF signal is a ROS-associated readout, not an absolute ROS concentration. | Main Fig. 1c–d |
| Reporter expression in vitro | Luciferase higher than ODA and comparable to ALC-0315; GFP images show the same qualitative trend. | DC2.4; luciferase n=3. Dose for this DA comparison is not explicitly specified in the supplied method. | Main Fig. 1e–f |
| Reporter expression in vivo | Stronger and more sustained bioluminescence than ODA; comparable to ALC-0315. | Intramuscular luciferase mRNA-LNPs, mice, n=3. Do not transfer the 5 µg OVA dose to this experiment. | Main Fig. 2e–f; SI Figs. S19, S22 |
| Tissue ROS | Lower ROS-associated signal, particularly in lymph nodes and spleen. | 12 h after intramuscular injection; flow cytometry of tissue suspensions; n=3. | Main Fig. 2a–d |
| Cellular uptake | Approximately 90% Cy5-positive DC2.4 cells. | Cy5-labeled mRNA, 6 h, n=3; this is cargo uptake, not 90% functional transfection. | Main §2.4; Fig. 3a |
| Endosomal escape evidence | Reduced Cy5-mRNA/Lysotracker colocalization from 2 to 8 h. | DC2.4 confocal microscopy; qualitative/colocalization evidence, not a quantified escape percentage. | Main Fig. 3d; SI Fig. S21 |
| Draining lymph node delivery | Higher Cy5-positive cell fraction and lymph-node reporter expression than ODA. | 12 h after intramuscular administration; n=3 in main lymph-node uptake comparison. | Main Fig. 3e–f; SI Fig. S22 |
| Prophylactic tumor suppression | Reduced B16-OVA growth versus PBS and ODA; comparable to ALC-0315. | Female C57BL/6, 6–7 weeks; OVA mRNA 5 µg per vaccination, days −7/−4/−1; 10^6 tumor cells on day 0; follow-up to day 21; n=5. | Main §4.7; Fig. 4a–b |
| Tumor immune response | Higher CD8+ fraction among CD3+ cells and IFN-γ+ fraction among CD8+ cells than ODA. | Tumor flow cytometry, n=4; comparable to ALC-0315. Representative FCM percentages are not group means. | Main Fig. 4c–f; SI Figs. S26–S27 |
| Lymph-node antigen presentation | Increased CD86+ MHC-II+ and SIINFEKL–H-2Kb+ fractions in CD11c+ cells versus ODA. | Prophylactic vaccination study; n=5. | Main Fig. 4i–j; SI Fig. S29 |
| Tolerability observations | No significant reduction in tested cell-viability signals; less than 5% hemolysis at tested concentrations; no significant serum-marker differences reported. | Tested cell and mouse conditions only; not clinical safety or long-term tolerability evidence. | Main Fig. 5; §2.6 |
Evidence limits
- The paper names DMG-PEG but does not specify the PEG molecular-weight grade. DMG-PEG2000 (catalog MW 2507) below is a proposed catalog planning option, not a verified source reagent grade.
- The paper reports total lipid:mRNA = 20:1 without explicitly identifying its mass/molar basis. It is not an N/P ratio. No N/P or RNA amount is back-calculated.
- Neutral connectivity is confirmed by SI Figs. S5–S6 and the synthesis name. TFA is used for final deprotection, but final salt stoichiometry/counterion and neutralization are not explicitly established. Formula and MW here describe the depicted neutral molecule; do not label a TFA salt without batch confirmation.
- Two tail branching stereocenters are unspecified in the paper. No stereopure or racemic composition claim is made.
- No numerical PDI, encapsulation percentage or fitted exact pKa is tabulated. DLS distribution plots and a gel-retardation image do not justify invented precise values.
- The apparent LNP pKa is described as 6.0–7.0; the plotted TNS midpoint is around pH 6. No extra decimal precision is assigned.
- The 5 µg OVA dose belongs to the vaccine experiment. The 1 µg/mL dose in §4.6 belongs to NAC-pretreated ALC-0315/SM102 experiments and must not be copied to DA experiments.
- B16-OVA tumor cells were injected subcutaneously; LNP vaccination was intramuscular. This is prophylactic vaccination, not treatment of established tumors.
- SI Fig. S6 is an integer-labeled mass spectrum, not an explicit high-resolution calculated/found mass assignment. Average MW 830.33 is calculated from the structure rather than copied from m/z.
Values shown are literature-reported results for the cited formulation and study conditions. They do not guarantee performance of the supplied product in other formulations or experiments.
Reference
Fang G, Tu Z, Feng H, Wu R, Xing Y, Li H, Xiang L, Shi Z, Zhang C, Hao K, Tian H. Design of lipid nanoparticles with potent reactive oxygen species scavenging capacity for efficient mRNA delivery. Nano Research. 2026;19:94909223. doi:10.26599/NR.2026.94909223. Just Accepted, available online 28 September 2026. Supplied file includes the main article and Electronic Supplementary Material, Figs. S1–S29. Read article
Structure and synthesis overview
DA lipid contains a 3,4-dihydroxyphenethyl headgroup, one tertiary amine and two six-carbon spacers ester-linked to 2-hexyldecanoate tails. The catechol is retained in DA; oxidation produces the quinone-containing ODA control.
The reported route prepares 6-bromohexyl 2-hexyldecanoate, alkylates protected dopamine with two lipid tails, then removes the catechol protecting group using TFA/dichloromethane. The terminal deprotection does not by itself establish the final isolated counterion or salt stoichiometry. No stereochemical configuration is assigned to the tail branch centers.
Observed structure–activity relationship: the DA/ODA comparison supports a role for the intact catechol in antioxidant activity and mRNA-derived expression under the tested conditions. The comparison does not isolate every possible effect of oxidation on formulation properties.
Source: Main §§2.1, 4.1; SI Figs. S1–S9.