
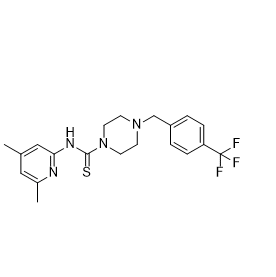
Biological Activity & Performance
| Endpoint | Model / source | Reported finding |
|---|---|---|
| Biochemical potency | PHGDH enzyme assay; Table 1 [1] | IC50 2.5 ± 0.6 µM; n = 4. This is an enzyme-assay value, not a cellular IC50. |
| Mechanism | Competition and dilution experiments; Fig. 1 [1] | Reversible inhibition; noncompetitive with 3-phosphoglycerate and NAD+. |
| Cellular response | Five PHGDH-dependent cell lines; Fig. 3 [1] | Growth/viability EC50 8–16 µM. MDA-MB-231 was less sensitive; responses differed across models. |
| Target engagement | Glucose tracing in breast cancer cells; Fig. 2 [1] | Reduced glucose-derived serine labeling supported pathway inhibition. |
| Animal activity | Breast cancer xenografts; Fig. 3 [1] | Reduced growth and weight of PHGDH-dependent MDA-MB-468 tumors; the PHGDH-independent MDA-MB-231 model did not show the same response. |
How to interpret the evidence
Use PHGDH expression and pathway readouts to interpret cellular results. Independent work found altered glucose-carbon entry into the TCA cycle in PHGDH-knockout neuroblastoma cells, demonstrating an off-target effect [2]. A viability response alone does not establish PHGDH dependence.