
Two-page literature and handling guide
Download PDF · View online| Catalog No. | DCL0011 |
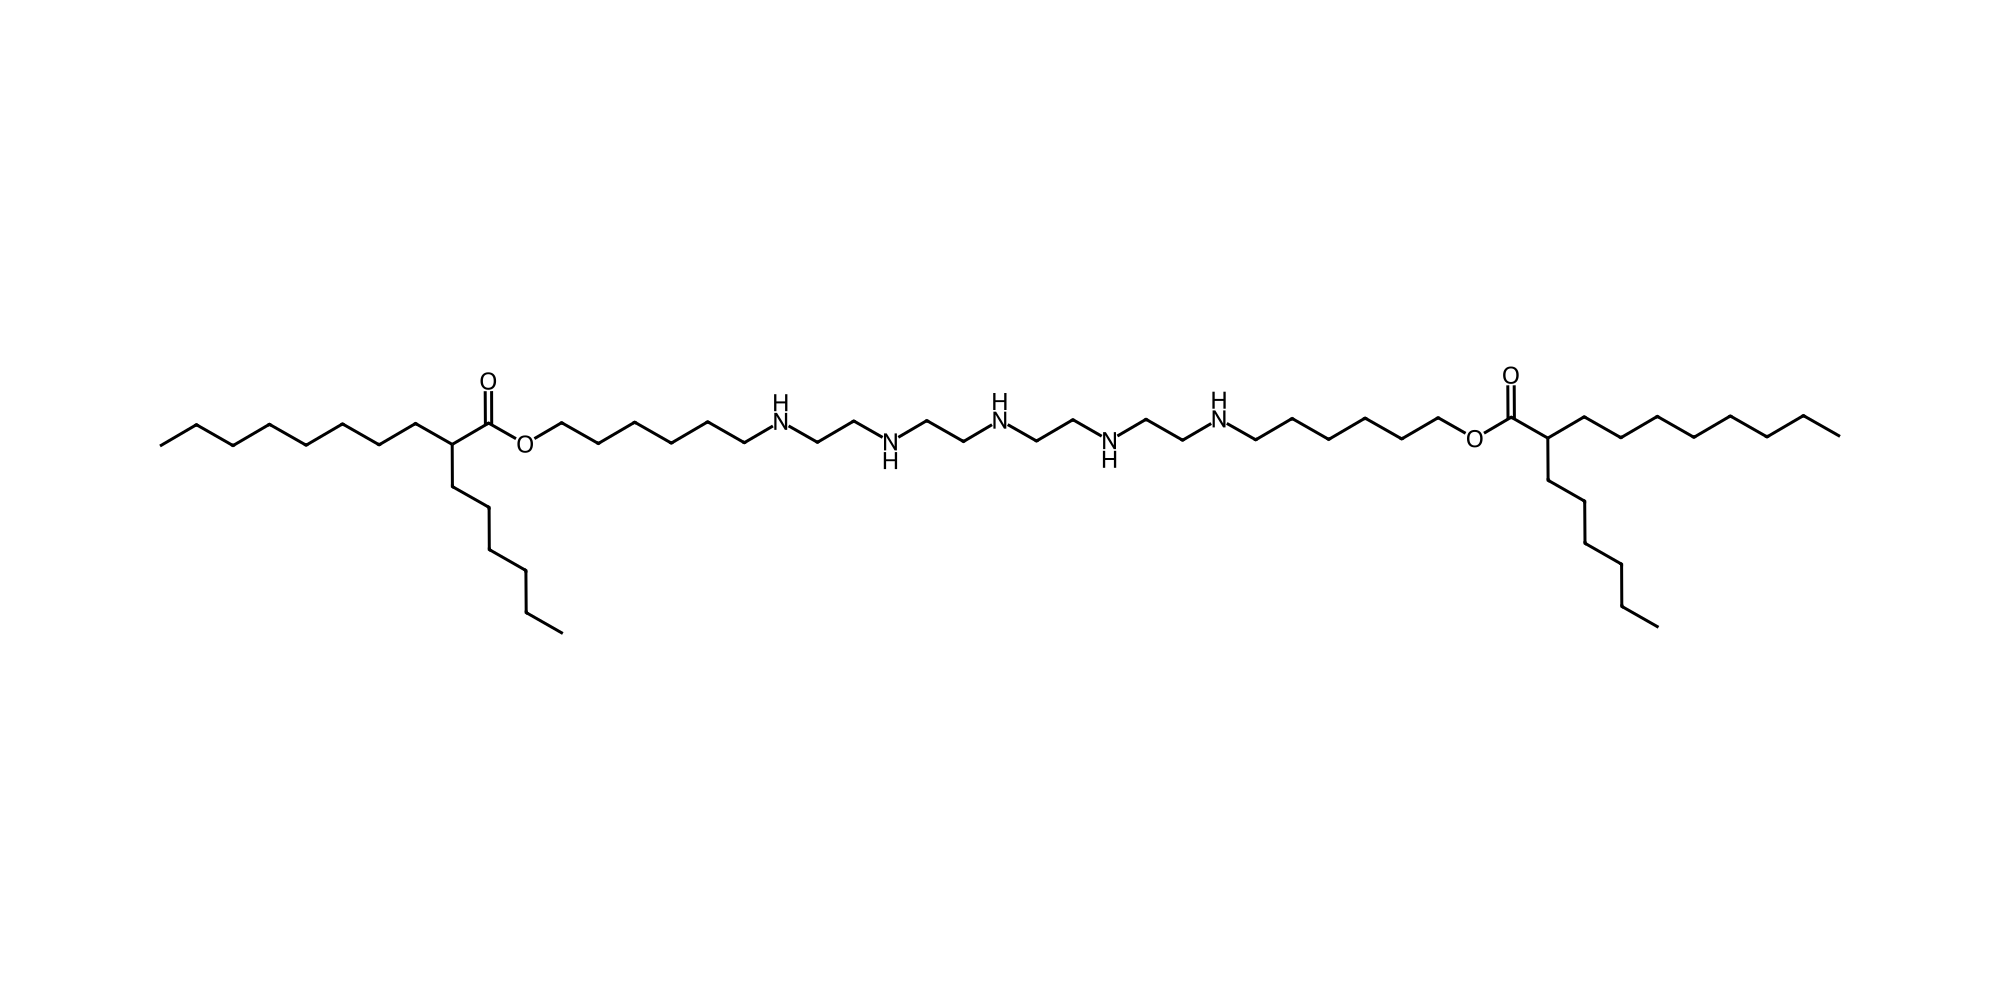
| Chemical Name | PA97MD101 |
| Synonyms | PA97-MD101; PA97 MD101 |
| Formula | C52H107N5O4 |
| M.Wt | 866.46 |
| SMILES | CCCCCCCCC(CCCCCC)C(=O)OCCCCCCNCCNCCNCCNCCNCCCCCCOC(=O)C(CCCCCC)CCCCCCCC |
| CAS No. | Not available |
| Purity | Inquire for batch-specific COA |
| Availability | Inquire for availability |
| Stereochemistry | Two unassigned branched-tail stereocenters |
| Salt / solvate | Neutral structure; no counterion or solvate depicted |
| Storage | Store at -20°C; follow batch-specific handling information. |
SMILES, formula and average molecular weight are calculated from the assigned PA97MD101 structure in Supplementary Fig. 22 (pp. 23-24). The reported neutral exact mass is 865.83231; it is not the average molecular weight used in the calculator.
Categories: Cationic/Ionizable Lipids · Ionizable Lipids for Gene Editing
Literature LNP formulation
| Components / mol% | PA97MD101 / DSPC / Cholesterol / PEG-DMG (PEG2000) = 50 / 10 / 38.5 / 1.5 (total 100%) |
| N/P ratio | Not reported |
| Preparation | Microfluidic mixing; ethanol 3 mL/min + aqueous phase 9 mL/min; total flow 12 mL/min |
| Aqueous phase | 10 mM sodium citrate, pH 4.5 |
| Post-processing | At least three 30 kDa centrifugal-filter wash cycles, then 0.22 μm filtration; adjusted to 1 mg/mL total lipid; formulated LNPs stored at 4°C until use |
| Apparent LNP pKa | 6.85 (TNS fluorescence titration) |
| mRNA encapsulation | 91.19 ± 0.58% SD; n = 3 independent samples (RiboGreen assay) |
| Mass ratio | 40:1 lipid:mRNA is specified for the in vitro screen; it is not an N/P ratio and is not assigned here to the in vivo experiments |
Main Methods pp. 10-11; Supplementary Fig. 25, p. 26. Exact particle size and PDI are not transcribed from plotted figures.
Values shown are literature-reported results for the cited formulation and study conditions. They do not guarantee performance of the supplied product in other formulations or experiments.
Reference [1]: Zhang Z, Ren Y, Kong D, et al. Interpretable AI-guided discovery of degradable ionizable lipids with enhanced hepatic mRNA delivery in vivo. Nature Communications (2026), Article in Press. doi:10.1038/s41467-026-78635-1. Exact source locations are given above.
Component molecular weights & formulation ratios
The four-component molar ratio is 50 : 10 : 38.5 : 1.5 (100 mol% in total), reported in the main Methods [1]. The masses below are calculated, not measured or reported preparation quantities.
| Component | Average MW (g/mol) | Literature mol% | Amount (µmol) | Calculated mass (mg) | Calculated mass% |
|---|---|---|---|---|---|
| PA97MD101 DCL0011 | 866.46 Calculated from verified neutral structure [1] | 50 | 0.500000 | 0.433230 | Pending PEG-DMG MW |
| DSPC DC57005 | 790.15 DC Chemicals specification [2] | 10 | 0.100000 | 0.079015 | Pending PEG-DMG MW |
| Cholesterol DCD-041 | 386.65 DC Chemicals specification [3] | 38.5 | 0.385000 | 0.148860 | Pending PEG-DMG MW |
| PEG-DMG (PEG2000) DC40169 | Batch-specific; enter above [4] | 1.5 | 0.015000 | Pending PEG-DMG MW | Pending PEG-DMG MW |
| Total | — | 100 | 1.000000 | Pending PEG-DMG MW | Pending PEG-DMG MW |
Enter the confirmed PEG-DMG molecular weight to calculate its mass and all four mass fractions.
PEG-DMG is a polymer distribution. The paper specifies PEG2000-DMG but does not report a batch molecular weight. For DC40169, confirm the average molecular weight of the complete PEG-lipid conjugate from the batch documentation before weighing. The nominal PEG chain designation “2000” is not used automatically as the whole-conjugate molecular weight [1,4].
Calculation: nᵢ = total µmol × mol%ᵢ / 100; massᵢ (mg) = nᵢ (µmol) × MWᵢ / 1000; mass%ᵢ = massᵢ / sum(masses) × 100. Masses include lipid components only, without RNA, solvent or buffer. This conversion does not establish an N/P ratio or an in vivo lipid:RNA ratio.
Source [1]: main Methods pp. 10–11 (composition and preparation); Supplementary Fig. 22, pp. 23–24 (PA97MD101 identity). Component specifications [2–4] refer to DC Chemicals products; they are not molecular weights measured in the paper. View references ↓
Reference [1]: Zhang Z, Ren Y, Kong D, et al. Interpretable AI-guided discovery of degradable ionizable lipids with enhanced hepatic mRNA delivery in vivo. Nature Communications (2026), Article in Press. doi:10.1038/s41467-026-78635-1. Exact source locations are given above.
Hepatic luciferase expression
| Cargo | Fluc mRNA |
| Route | Intravenous, tail vein |
| Dose | 0.1 mg/kg mRNA, single injection |
| Model | C57BL/6 mice, 6-8 weeks; n=3/group |
| Readout time | 6 h |
Hepatic Fluc expression: Approximately 4-fold higher than SM-102 (author-reported approximation).
Main Results p.6 and Discussion p.8; Fig.5c-e; Methods p.10. Comparator: SM-102, matched cargo/dose/route/time.
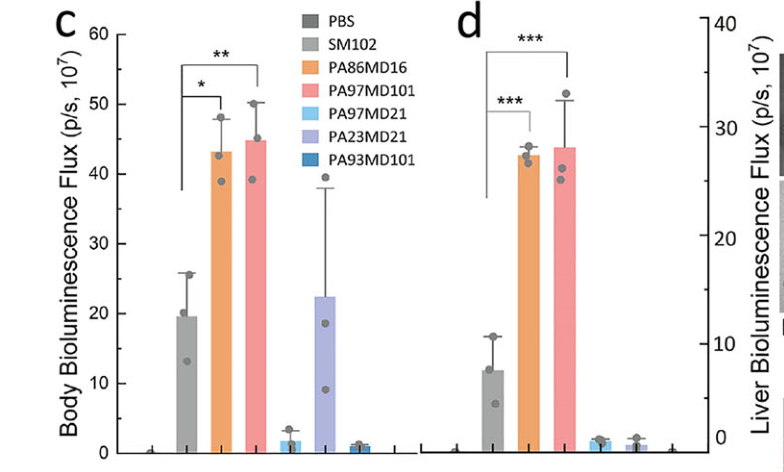
Cropped from Zhang et al., Fig. 5c-d; labels and axes retained. CC BY 4.0.
Values shown are literature-reported results for the cited formulation and study conditions. They do not guarantee performance of the supplied product in other formulations or experiments.
Reference [1]: Zhang Z, Ren Y, Kong D, et al. Interpretable AI-guided discovery of degradable ionizable lipids with enhanced hepatic mRNA delivery in vivo. Nature Communications (2026), Article in Press. doi:10.1038/s41467-026-78635-1. Exact source locations are given above.
Cre-dependent liver recombination
| Cargo | Cre mRNA |
| Route | Intravenous, tail vein |
| Dose | 0.25 mg/kg mRNA, single injection |
| Model | mTmG reporter mice; n=3/group |
| Readout time | Day 3 |
Liver-level Cre-dependent functional output: Approximately 6.75-fold higher liver-level Cre-dependent recombination reported in Discussion; fluorescence and LoxP qPCR support functional delivery.
Main Discussion p.8; Fig.5g-j; Methods pp.11-12; SI Figs.34-42. Comparator: SM-102.
Cell-population-resolved output: Greater EGFP activation in CD31-/CD45- hepatocyte-enriched cells; not hepatocyte-exclusive or proof of receptor-specific targeting.
Main Results p.6; Fig.5i-j; SI Fig.41 (p.41). Comparator: SM-102.
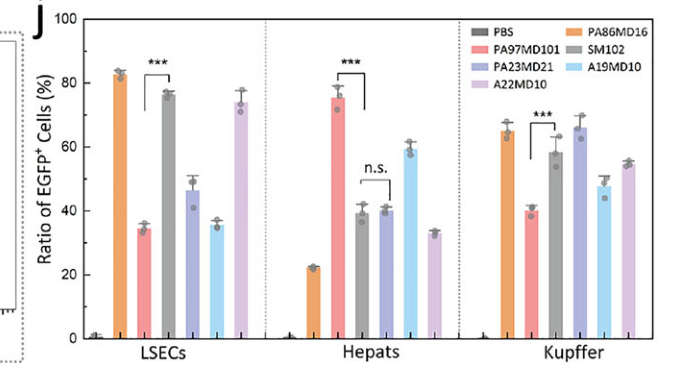
Cropped from Zhang et al., Fig. 5j. EGFP activation measures functional delivery and recombination, not nanoparticle uptake alone. CC BY 4.0.
Values shown are literature-reported results for the cited formulation and study conditions. They do not guarantee performance of the supplied product in other formulations or experiments.
Reference [1]: Zhang Z, Ren Y, Kong D, et al. Interpretable AI-guided discovery of degradable ionizable lipids with enhanced hepatic mRNA delivery in vivo. Nature Communications (2026), Article in Press. doi:10.1038/s41467-026-78635-1. Exact source locations are given above.
Cas9/sgTtr delivery and TTR suppression
| Cargo | Cas9 mRNA + sgTtr, 5:1 mass ratio |
| Route | Intravenous, tail vein |
| Dose | Per injection: Cas9 mRNA 0.25 mg/kg plus sgRNA 0.05 mg/kg; two consecutive daily injections. sgRNA dose and 0.30 mg/kg total RNA per injection are calculated from 5:1. |
| Model | C57BL/6 mice; n=3/group |
| Readout time | Day 7 after first injection |
Ttr transcript and serum TTR suppression: Lower hepatic Ttr FISH signal and serum TTR than SM-102; transcript/protein endpoints, not a measured genomic editing percentage.
Main Fig.6c-e, Results p.6, Methods p.11; SI Fig.46. Comparator: SM-102; PBS; Methods also describe a Cas9-only control.
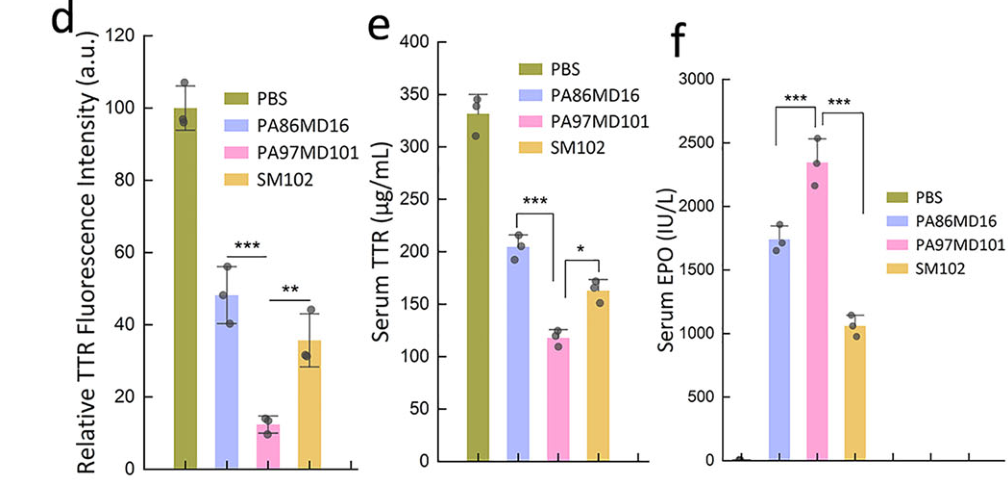
Cropped from Zhang et al., Fig. 6d-f; hEPO in panel f belongs to the separate experiment below. CC BY 4.0.
Values shown are literature-reported results for the cited formulation and study conditions. They do not guarantee performance of the supplied product in other formulations or experiments.
Reference [1]: Zhang Z, Ren Y, Kong D, et al. Interpretable AI-guided discovery of degradable ionizable lipids with enhanced hepatic mRNA delivery in vivo. Nature Communications (2026), Article in Press. doi:10.1038/s41467-026-78635-1. Exact source locations are given above.
Secreted hEPO expression
| Cargo | hEPO mRNA |
| Route | Intravenous, tail vein |
| Dose | 0.25 mg/kg mRNA |
| Model | C57BL/6 mice; n=3/group |
| Readout time | 24 h |
Serum hEPO: Higher serum hEPO than SM-102 and PA86MD16; exact concentrations not transcribed from graph.
Main Fig.6f, Results p.6, Methods pp.10-11. Comparator: SM-102 and PA86MD16.
Values shown are literature-reported results for the cited formulation and study conditions. They do not guarantee performance of the supplied product in other formulations or experiments.
Reference [1]: Zhang Z, Ren Y, Kong D, et al. Interpretable AI-guided discovery of degradable ionizable lipids with enhanced hepatic mRNA delivery in vivo. Nature Communications (2026), Article in Press. doi:10.1038/s41467-026-78635-1. Exact source locations are given above.
Mechanistic and tolerability observations
PA97MD101 and PA86MD16 showed reduced lysosomal colocalization in HeLa cells. Acidic-pH hemolysis and lipid-mixing assays support pH-dependent membrane activity. These observations are compatible with improved intracellular release; they do not demonstrate a specific hepatocyte receptor mechanism.
The study found no overt injury in examined acute histology and lower cytokine responses for PA97MD101 in the plotted comparisons. This does not establish chronic or clinical safety. The cytokine-specific dose and cargo are not fully resolved in the supplied methods.
Main Fig. 4 and Fig. 6g-m; Supplementary Figs. 23-25 and 48-49. Animal results generally n = 3 per group.
Values shown are literature-reported results for the cited formulation and study conditions. They do not guarantee performance of the supplied product in other formulations or experiments.
Reference [1]: Zhang Z, Ren Y, Kong D, et al. Interpretable AI-guided discovery of degradable ionizable lipids with enhanced hepatic mRNA delivery in vivo. Nature Communications (2026), Article in Press. doi:10.1038/s41467-026-78635-1. Exact source locations are given above.
References for formulation & performance
- Zhang Z, Ren Y, Kong D, et al. Interpretable AI-guided discovery of degradable ionizable lipids with enhanced hepatic mRNA delivery in vivo. Nature Communications (2026), Article in Press. doi:10.1038/s41467-026-78635-1. Main Methods pp. 10–11; Fig. 5 (Fluc/Cre); Fig. 6 (Cas9/sgTtr, hEPO and acute observations). Supplementary Fig. 22, pp. 23–24 (identity); Fig. 25, p. 26 (pKa and encapsulation). Page numbers refer to the supplied article-in-press PDF and supplementary PDF. Supplementary information is accessible through the publisher article page.
- DC Chemicals. 1,2-DSPC (DC57005). Molecular weight 790.15 g/mol, rounded from the product specification.
- DC Chemicals. Cholesterol (DCD-041). Molecular weight 386.65 g/mol.
- DC Chemicals. DMG-PEG2000 (DC40169). Confirm the complete conjugate average molecular weight from the batch documentation; no fixed value is preselected in this calculator.
DC Chemicals component specifications checked 14 October 2026. The cited paper provides the formulation and performance evidence; product links identify corresponding catalog components.
Primary reference
Zhang Z, Ren Y, Kong D, Feng J, Hu K, Xu X, Deng F, Li P, Wang J, Huang W, Wei G, Su Y, Tan Y, Zhang S, Sun X, Kang F, Yan H. Interpretable AI-guided discovery of degradable ionizable lipids with enhanced hepatic mRNA delivery in vivo. Nature Communications. 2026. Article in Press. doi:10.1038/s41467-026-78635-1.
Read the paper and supplementary information ↗
Structure: Supplementary Fig. 18 (H97 and T101), Fig. 22 (PA97MD101 structure and characterization, pp. 23-24); synthesis: Route II, main Methods p. 10. The source describes the assigned predominant structure and notes that trace regioisomeric or secondary-amine-derived species cannot be excluded.
Scientific figures are cropped from Zhang et al. (2026), with attribution under CC BY 4.0. No scientific labels or data were changed.
Batch-specific documents available on request.
Request documents