sales@dcchemicals.com
LC-1 (LC-lipid-1)
Formulation & Performance
Route-specific LNP formulations for large RNA and genome editing
LC-1 was evaluated with Cas9 mRNA, adenine base-editor mRNA and approximately 10.5-kb self-amplifying RNA. The study optimized different lipid compositions for liver/lung and brain delivery, then compared them with ALC-0315 and LP-01 formulations.
Brain data: intrathecal dosing. Lung data: intratracheal dosing. These results do not establish intravenous brain or lung targeting.Dong S, et al. Nature Biotechnology (2026). 10.1038/s41587-026-03298-8
1. Published formulation compositions
| Formulation | Component order | Molar ratio (mol%) | Figure-reported N/P | Experimental use |
|---|---|---|---|---|
| Initial screening | LC-1 DCL0004 / DSPC DC57005 / Cholesterol DCD-041 / DMG-PEG2000 DC40169 | 50:10:38.5:1.5 | 10 | Initial cell screening; not the optimized route-specific composition |
| Liver / lung optimized DOE-07 | LC-1 DCL0004 / DOPE DC33634 / Cholesterol DCD-041 / DMG-PEG2000 DC40169 | 30:30:39.5:0.5 | 5 | Intravenous liver delivery OR intratracheal lung delivery |
| Brain optimized DOE-11 | LC-1 DCL0004 / DOPE DC33634 / Cholesterol DCD-041 / DMG-PEG2000 DC40169 | 60:30:8:2 | 7.5 | Intrathecal brain delivery |
Each composition totals 100 mol%. The design-of-experiments screen compared 18 candidate formulations with approximately 5.7-kb ABE–NanoLuc mRNA; the selected formulations were then evaluated in separate editing studies.
Source: Main Results p. 4; Fig. 2b–i, p. 5; Methods p. 16 [1]. Page numbers refer to the supplied PDF.
2. Component molecular weights & mass conversion
Calculate component amounts from a chosen total lipid quantity. Molecular weights below are DC Chemicals product specifications; the paper supplies the molar compositions. Calculated masses are preparation aids, not experimental measurements.
Calculation: component µmol = total µmol × mol% / 100; component mg = component µmol × MW / 1000; mass fraction = component mg / total mg × 100. RNA quantity and N/P are not calculated.
Source: Compositions: main Fig. 2. LC-1 identity: Supplementary Fig. 28, p. 20. Component specifications checked 14 October 2026; product links in the table [1]. Page numbers refer to the supplied PDF.
3. Preparation & physicochemical characterization
| Parameter | Reported information |
|---|---|
| Lipid / aqueous phases | Lipids in ethanol; RNA in 10 mM citrate buffer, pH 4.0 |
| Mixing ratio | Aqueous:ethanol = 3:1 (v/v) |
| Mixing method | Rapid pipette mixing for in vitro formulations; microfluidic mixing for in vivo formulations |
| Total flow rate | Not reported in the supplied Methods |
| Buffer exchange | Overnight dialysis at 4 °C into 1× DPBS; 10 kDa MWCO |
| Cas9 RNA ratio | Cas9 mRNA:sgRNA = 1:1 in vitro; 3:1 in vivo (mass ratio) |
| ABE RNA ratio | ABE mRNA:sgRNA = 1:1 (mass ratio), in vitro and in vivo |
| Apparent pKa | Not located in the supplied main paper or SI |
| Particle characterization | Diameter, PDI, zeta potential and encapsulation efficiency compared in Supplementary Fig. 54 (n = 3). Exact tabulated means are not supplied; no precise values are inferred from the plot. |
| Stability studies | Diameter/PDI assessed over 14 days at 4 °C and in a serum challenge (Supplementary Figs. 66–67, n = 3). These experiments do not establish the storage lifetime of neat LC-1. |
Source: Methods p. 16; Supplementary Figs. 54, 66–67, pp. 36, 48–49 [1]. Page numbers refer to the supplied PDF.
4. Cas9 reporter editing: five cell populations
Ai9 reporter mice; Cas9 mRNA + sgTOM, 3:1 mass ratio. Two administrations on days 1 and 7; readout on day 14; n = 3 animals per group. Doses below are those reported for each administration. The endpoint is the percentage of gated cells expressing TdTomato after functional reporter editing.
| Cell population | Route | Reported dose | LC-1 | ALC-0315 | LP-01 |
|---|---|---|---|---|---|
| hepatocytes | Intravenous | 1 mg/kg | 79.1% | 37.5% | 19.2% |
| neurons | Intrathecal | 0.1 mg/kg | 48.3% | 19.2% | 16.3% |
| astrocytes | Intrathecal | 0.1 mg/kg | 45.3% | 24.3% | 14.5% |
| lung epithelial cells | Intratracheal | 0.5 mg/kg | 27.3% | 15.4% | 7.8% |
| lung endothelial cells | Intratracheal | 0.5 mg/kg | 21.7% | 7.7% | 7.7% |
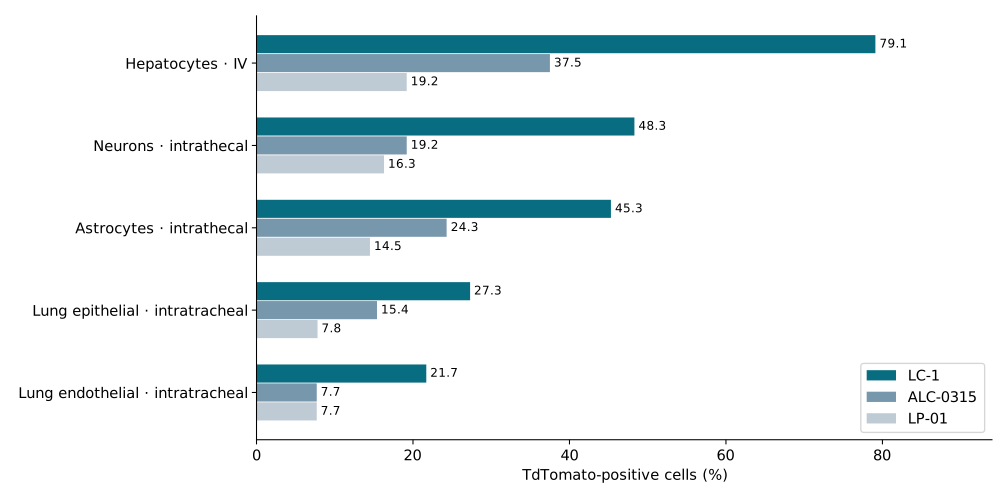
Source: Main Results pp. 4, 7; Fig. 2j–m, p. 5; Supplementary Figs. 59–61, pp. 41–43 [1]. Page numbers refer to the supplied PDF.
5. Adenine base editing: endpoint-specific evidence
Mouse Pcsk9: direct genomic base editing
C57BL/6 mice received a single intravenous 1 mg/kg dose of ABE8.8-m mRNA + Pcsk9 sgRNA (1:1 mass ratio), using the liver/lung optimized composition. Liver sequencing was performed on day 60; n = 3 per group.
| Endpoint | LC-1 | ALC-0315 | LP-01 |
|---|---|---|---|
| Hepatic Pcsk9 A-to-G editing (Sanger/EditR) | 79.5% | 57.5% | 41.5% |
| Plasma PCSK9 reduction, author-reported | 85.7% | 55.0% | 23.4% |
| Plasma LDL reduction, author-reported | 74.7% | 35.1% | 18.7% |
The 79.5% genomic editing result is a separate experiment from the 79.1% Cas9 reporter result above. Protein and LDL reductions are pharmacodynamic endpoints. Fig. 6f labels the LC-1 versus ALC-0315 LDL comparison P = 0.3171; the study does not support significant superiority for every endpoint.
Source: Main Results p. 9; Fig. 6a–f, pp. 11–12 [1]. Page numbers refer to the supplied PDF.
Human hepatocytes in a mouse model
Male FRGHuHep mice engrafted with human hepatocytes received one intravenous 1 mg/kg ABE mRNA/sgRNA dose. Reported human PCSK9 editing was 14.3% with LC-1, 6.2% with ALC-0315 and 6.3% with LP-01 (n = 3).
Source: Main Results p. 9; Fig. 6g–j, pp. 11–12; Methods p. 17 [1]. Page numbers refer to the supplied PDF.
CFTR R553X: local lung delivery
In CFTR R553X mice, intratracheal ABE8e-NG mRNA + sgRNA treatment produced approximately 10.5% correction with LC-1, 4.5% with ALC-0315 and 2% with LP-01 (n = 3). Two administrations were given on days 0 and 3, with assessment on day 13.
Source: Main Results p. 9; Fig. 6k–m, pp. 11–12 [1]. Page numbers refer to the supplied PDF.
LumA reporter: sustained functional readout
ABE8e-NGG mRNA + sgRNA (1:1 mass ratio) restored Fluc reporter activity in LumA mice. Signals appeared by week 1, peaked around weeks 1–2 and persisted through week 4. LC-1 gave higher responses than the benchmark formulations (n = 3 per group).
| Route | Reported dose | Composition | Readout |
|---|---|---|---|
| Intravenous | 2 mg/kg | 30:30:39.5:0.5 | Restored Fluc expression; follow-up to 4 weeks |
| Intrathecal | 0.1 mg/kg | 60:30:8:2 | Restored Fluc expression; follow-up to 4 weeks |
| Intratracheal | 1 mg/kg | 30:30:39.5:0.5 | Restored Fluc expression; follow-up to 4 weeks |
Reporter signal and stained area are not genomic editing percentages. The caption/text identify ABE8e-NGG, while the schematic labels ABE8.8m; editor labeling is inconsistent.
Source: Fig. 3 and accompanying text, pp. 6–7 [1]. Page numbers refer to the supplied PDF.
Endogenous brain target: Snord115 / Ube3a-ATS
Intrathecal delivery of ABE mRNA + Spjw33 gRNA at 0.05 mg/kg produced endogenous editing and reduced Snord115/Snord116 transcripts in mouse brain (n = 6). LC-1 showed stronger activity than the benchmark formulations. The exact brain readout time is not fully specified; these data do not demonstrate behavioral rescue of Angelman syndrome.
Source: Extended Data Fig. 1, p. 19; Supplementary Fig. 95, p. 70 [1]. Page numbers refer to the supplied PDF.
6. Large-RNA delivery beyond editor mRNA
Fluc self-amplifying RNA of approximately 10.5 kb was evaluated in mice. LC-1 produced robust expression relative to weaker ALC-0315 and LP-01 responses. These assays measured expression at 6 hours, not genome editing or long-term therapeutic efficacy.
| Route | Reported dose | Selected composition | Readout / n |
|---|---|---|---|
| Intravenous | 0.25 mg/kg | Liver/lung optimized | 6-hour luciferase expression; n = 3 |
| Intrathecal | 0.125 mg/kg | Brain optimized | 6-hour luciferase expression; n = 3 |
| Intratracheal | 0.25 mg/kg | Liver/lung optimized | 6-hour luciferase expression; n = 3 |
Supplementary characterization compared particle properties and retained inverse-hexagonal organization with saRNA. Exact expression fold changes are not inferred from the plotted bars.
Source: Main p. 9; Methods p. 17; Supplementary Figs. 96–98, pp. 71–74 [1]. Page numbers refer to the supplied PDF.
7. Mechanistic evidence & structural organization
Endosomal release
HepG2 imaging assays reported approximately twofold greater cytosolic mRNA release for LC-1 versus benchmark LNPs (n = 10). Galectin-9 recruitment and stronger membrane disruption at acidic pH provide supporting evidence. These assays are distinct from in vivo editing.
Structure–activity relationship
Analog comparisons support contributions from the cyclic headgroup and tert-butyl linker to performance. Molecular simulations suggest stronger lipid–RNA hydrogen bonding; this is mechanistic modeling rather than a measured receptor-binding affinity.
Source: Main Figs. 4–5, pp. 7–10; Supplementary Figs. 62–65 [1]. Page numbers refer to the supplied PDF.
ABE-LNP inverse-hexagonal SAXS contribution
| Condition | LC-1 | ALC-0315 | LP-01 |
|---|---|---|---|
| pH 7.4 | 27.5% | 7.2% | 5.4% |
| pH 5.5 | 59.6% | 40.8% | 24.3% |
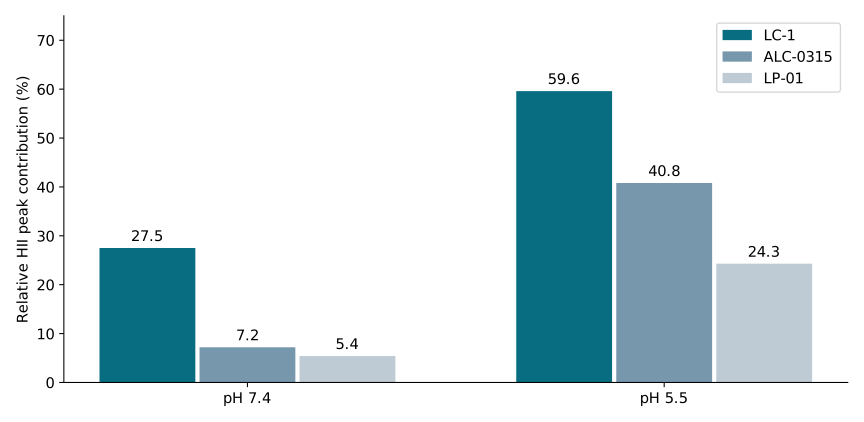
Source: Supplementary Table 4, p. 82; Methods pp. 16–17 [1]. Page numbers refer to the supplied PDF.
Tolerability: scope of the evidence
Mouse histology, cytokine and CD86 assays did not identify the specified abnormalities under the tested conditions. Repeat-dose reporter experiments were also reported. These findings do not establish chronic safety, clinical safety or an absence of immunogenicity. Comprehensive genome-wide off-target assessment was outside the delivery-focused study.
Source: Supplementary Figs. 93–94 and 99–101, pp. 68–69, 75–77 [1]. Page numbers refer to the supplied PDF.
8. References & data downloads
- Dong S, Gong F, Thomson T, et al. Lipid nanoparticles optimized for large RNA cargo and tissue targeting enhance in vivo genome editing. Nature Biotechnology (2026). doi:10.1038/s41587-026-03298-8. Main article and 85-page Supplementary Information. Formulations: Fig. 2 and Methods; Cas9: Fig. 2 and Supplementary Figs. 59–61; base editing: Figs. 3 and 6; mechanisms: Figs. 4–5; SAXS: Supplementary Table 4.
- DC Chemicals component specifications: LC-1 (DCL0004), DOPE (DC33634), DSPC (DC57005), Cholesterol (DCD-041), DMG-PEG2000 (DC40169). Molecular weights checked 14 October 2026. These specifications are not molecular-weight measurements from the paper.