sales@dcchemicals.com
CF3-2N6-UC18
Formulation & Performance
Formulation & Performance
Study-specific compositions, preparation conditions and experimental outcomes for CF3-2N6-UC18.
Full article and SI reviewed; final ecoLNP, route-dependent expression and separate Cre/CRISPR experiments are mapped.
1. Formulations and component amounts
Reported composition and calculated mass are separate. Molecular-weight inputs use the current catalog values; DMG-PEG2000 is fixed initially at 2507. Edit inputs only when using a verified alternative material.
Final ecoLNP
mol%Main Results: final optimized composition
| Component | Molecular weight | Molar parts | Normalized mol% | Amount (µmol) | Weight (mg) |
|---|---|---|---|---|---|
| CF3-2N6-UC18 | 15.200 | 25.1310 | 20.4139 | ||
| DOPE | 38.200 | 63.1582 | 46.9916 | ||
| Cholesterol | 45.800 | 75.7237 | 29.2786 | ||
| DMG-PEG2000 | 0.800 | 1.3227 | 3.3160 |
Calculated total: 100.0000 mg lipid. RNA, solvent and process loss are excluded.
How component weights are calculated
For total lipid mass M (mg), molar parts rᵢ and molecular weight MWᵢ: component mass = M × rᵢ × MWᵢ / Σ(r × MW). Component amount (µmol) = component mass (mg) × 1000 / MWᵢ. Molar parts are normalized only for the displayed percentage. The calculation does not infer N/P or RNA dose.
2. Preparation and experimental setup
| Parameter | Reported procedure / limitation | Source |
|---|---|---|
| RNA ratio | CF3-2N6-UC18:mRNA = 4:1 by mass (ionizable lipid only); N/P is not reported. | Final formulation Results |
| Assembly | Lipid ethanol phase containing 10% v/v citrate buffer (50 mM, pH 3) mixed 1:1 with mRNA in the same citrate buffer by manual pipetting. | Methods: preparation of lipid-based formulations |
| Post-mixing | Dilute with an equal volume of PBS and incubate 10 min at room temperature. In vivo batches were prepared at 2.5× concentration and dialyzed against PBS using 3.5 kDa devices. | Methods |
| Optimization lineage | CCD rounds began with other CF3 lipids. The 15.3:38.4:46.1:0.2 intermediate recipe belongs to CF3-3N6-C17, not the final product. | Fig. 3; SI Tables 2–4 |
3. Particle characterization
| Measurement / batch | Reported result | Evidence context |
|---|---|---|
| Manual-pipetted final ecoLNP | Approximately 200 nm; PDI 0.2; encapsulation 98%; zeta potential +25.8 mV | Fig. 4a; SI Fig. 8a |
| RNA protection | Encapsulated RNA resisted 10% FBS or RNase A 50 µg/mL for 6 h in the reported assay | Fig. 4c; free-RNA controls use a lower RNase concentration |
| pH-dependent membrane disruption | 43.9% hemolysis at pH 5.4 at the highest 6.25× test concentration; no visible hemolysis at pH 7.4 under the reported conditions | Fig. 4d; a mechanistic assay, not a clinical safety threshold |
4. Performance by experiment
| Experiment and dose | Readout and comparator | Result and source |
|---|---|---|
| Reporter transfection 293T cells; eGFP mRNA, 50–200 ng/well; 2 × 10⁴ cells/well | Readout: 6–24 h depending on condition Comparator: Cell-transfection controls | >90% eGFP-positive cells was reported at low dose or short exposure; fluorescence intensity plateaued beyond the tested 200 ng / 24 h region.Fig. 4e–f; SI Fig. 8e–f |
| Route-dependent expression Female C57BL/6 mice; Fluc mRNA; IV, SC, IM and local eye/bladder routes | Readout: Route-specific imaging endpoints Comparator: Untreated / route-specific controls | IV expression predominated in liver/spleen; IM favored lymph-node expression. SC, subconjunctival and subretinal injection are distinct routes.Fig. 6a; Methods |
| IM lymph-node distribution Fluc reporter; intramuscular comparative study | Readout: Fig. 6 imaging endpoint Comparator: SM-102 study LNP | Lymph nodes accounted for 90.2% versus 58.1% of measured ex vivo luminescence. This is a share of reporter signal, not 90.2% of injected lipid or RNA. Overall delivery potency was similar.Fig. 6b–d; n=4, mean ± SEM; unpaired two-tailed t test |
| Cre recombination Ai9 male mice; intramuscular Cre mRNA 0.5 mg/kg, single injection | Readout: Day 7 Comparator: PBS-treated leg | Injected-site tdTomato fluorescence increased 4.7-fold; tissue sections and PCR supported recombination. This is Cre-mediated recombination, not a CRISPR editing percentage.Fig. 6e,g,i,j; Methods |
| CRISPR reporter editing Ai9 mice; IM Cas9 mRNA:gRNA 3:1 by mass, total RNA 1 mg/kg on days 0 and 7 | Readout: Day 14 Comparator: Study reporter controls | tdTomato activation and tissue/genomic analyses support editing of the reporter cassette. The Cre dose and endpoint are not applied to this experiment.Fig. 6f,h,i; SI Fig. 15; Methods |
| Formulated-RNA storage eGFP-loaded ecoLNP at 4 °C | Readout: At least 8 days Comparator: Warmer non-frozen storage conditions | Particle size and transfection activity were maintained at 4 °C. At warmer temperatures activity declined even when size changed little.Fig. 4b; SI Fig. 8b–c |
Mechanistic evidence
Inhibitor, colocalization, lysosomal-pH and calcein-release experiments support endosomal disruption. Pharmacological inhibition is not an exclusive uptake-pathway assignment. The quinoline-free comparator and docking analysis provide different levels of mechanistic evidence.
5. Interpretation and unresolved details
- Anatomical reporter-signal fractions do not measure injected-dose biodistribution.
- The source uses an SM-102 research formulation; it is not a head-to-head comparison of finished commercial vaccines.
- Histology shortly after a single 0.5 mg/kg dose does not establish repeat-dose or long-term tolerability.
- Molecular docking to saposin B is a mechanistic hypothesis, not direct target-binding proof.
Results apply to the stated LNP composition, cargo, process, dose, route and model. LNP experimental measurements are not batch-release specifications for the isolated lipid.
6. References and data access
Liu Z, Wu J, Wang N, et al. Structure-guided design of endosomolytic chloroquine-like lipid nanoparticles for mRNA delivery and genome editing. Nature Communications. 2025;16:4241.
DOI: 10.1038/s41467-025-59501-y
Download experiment table (CSV) · Open printable Formulation & Performance guide
Revision FP-20261022 · Source review: 22 October 2026 · DC Chemicals
Published study figures
Original publication figures illustrating the cited formulation and biological results. Select an image to view it at full size.
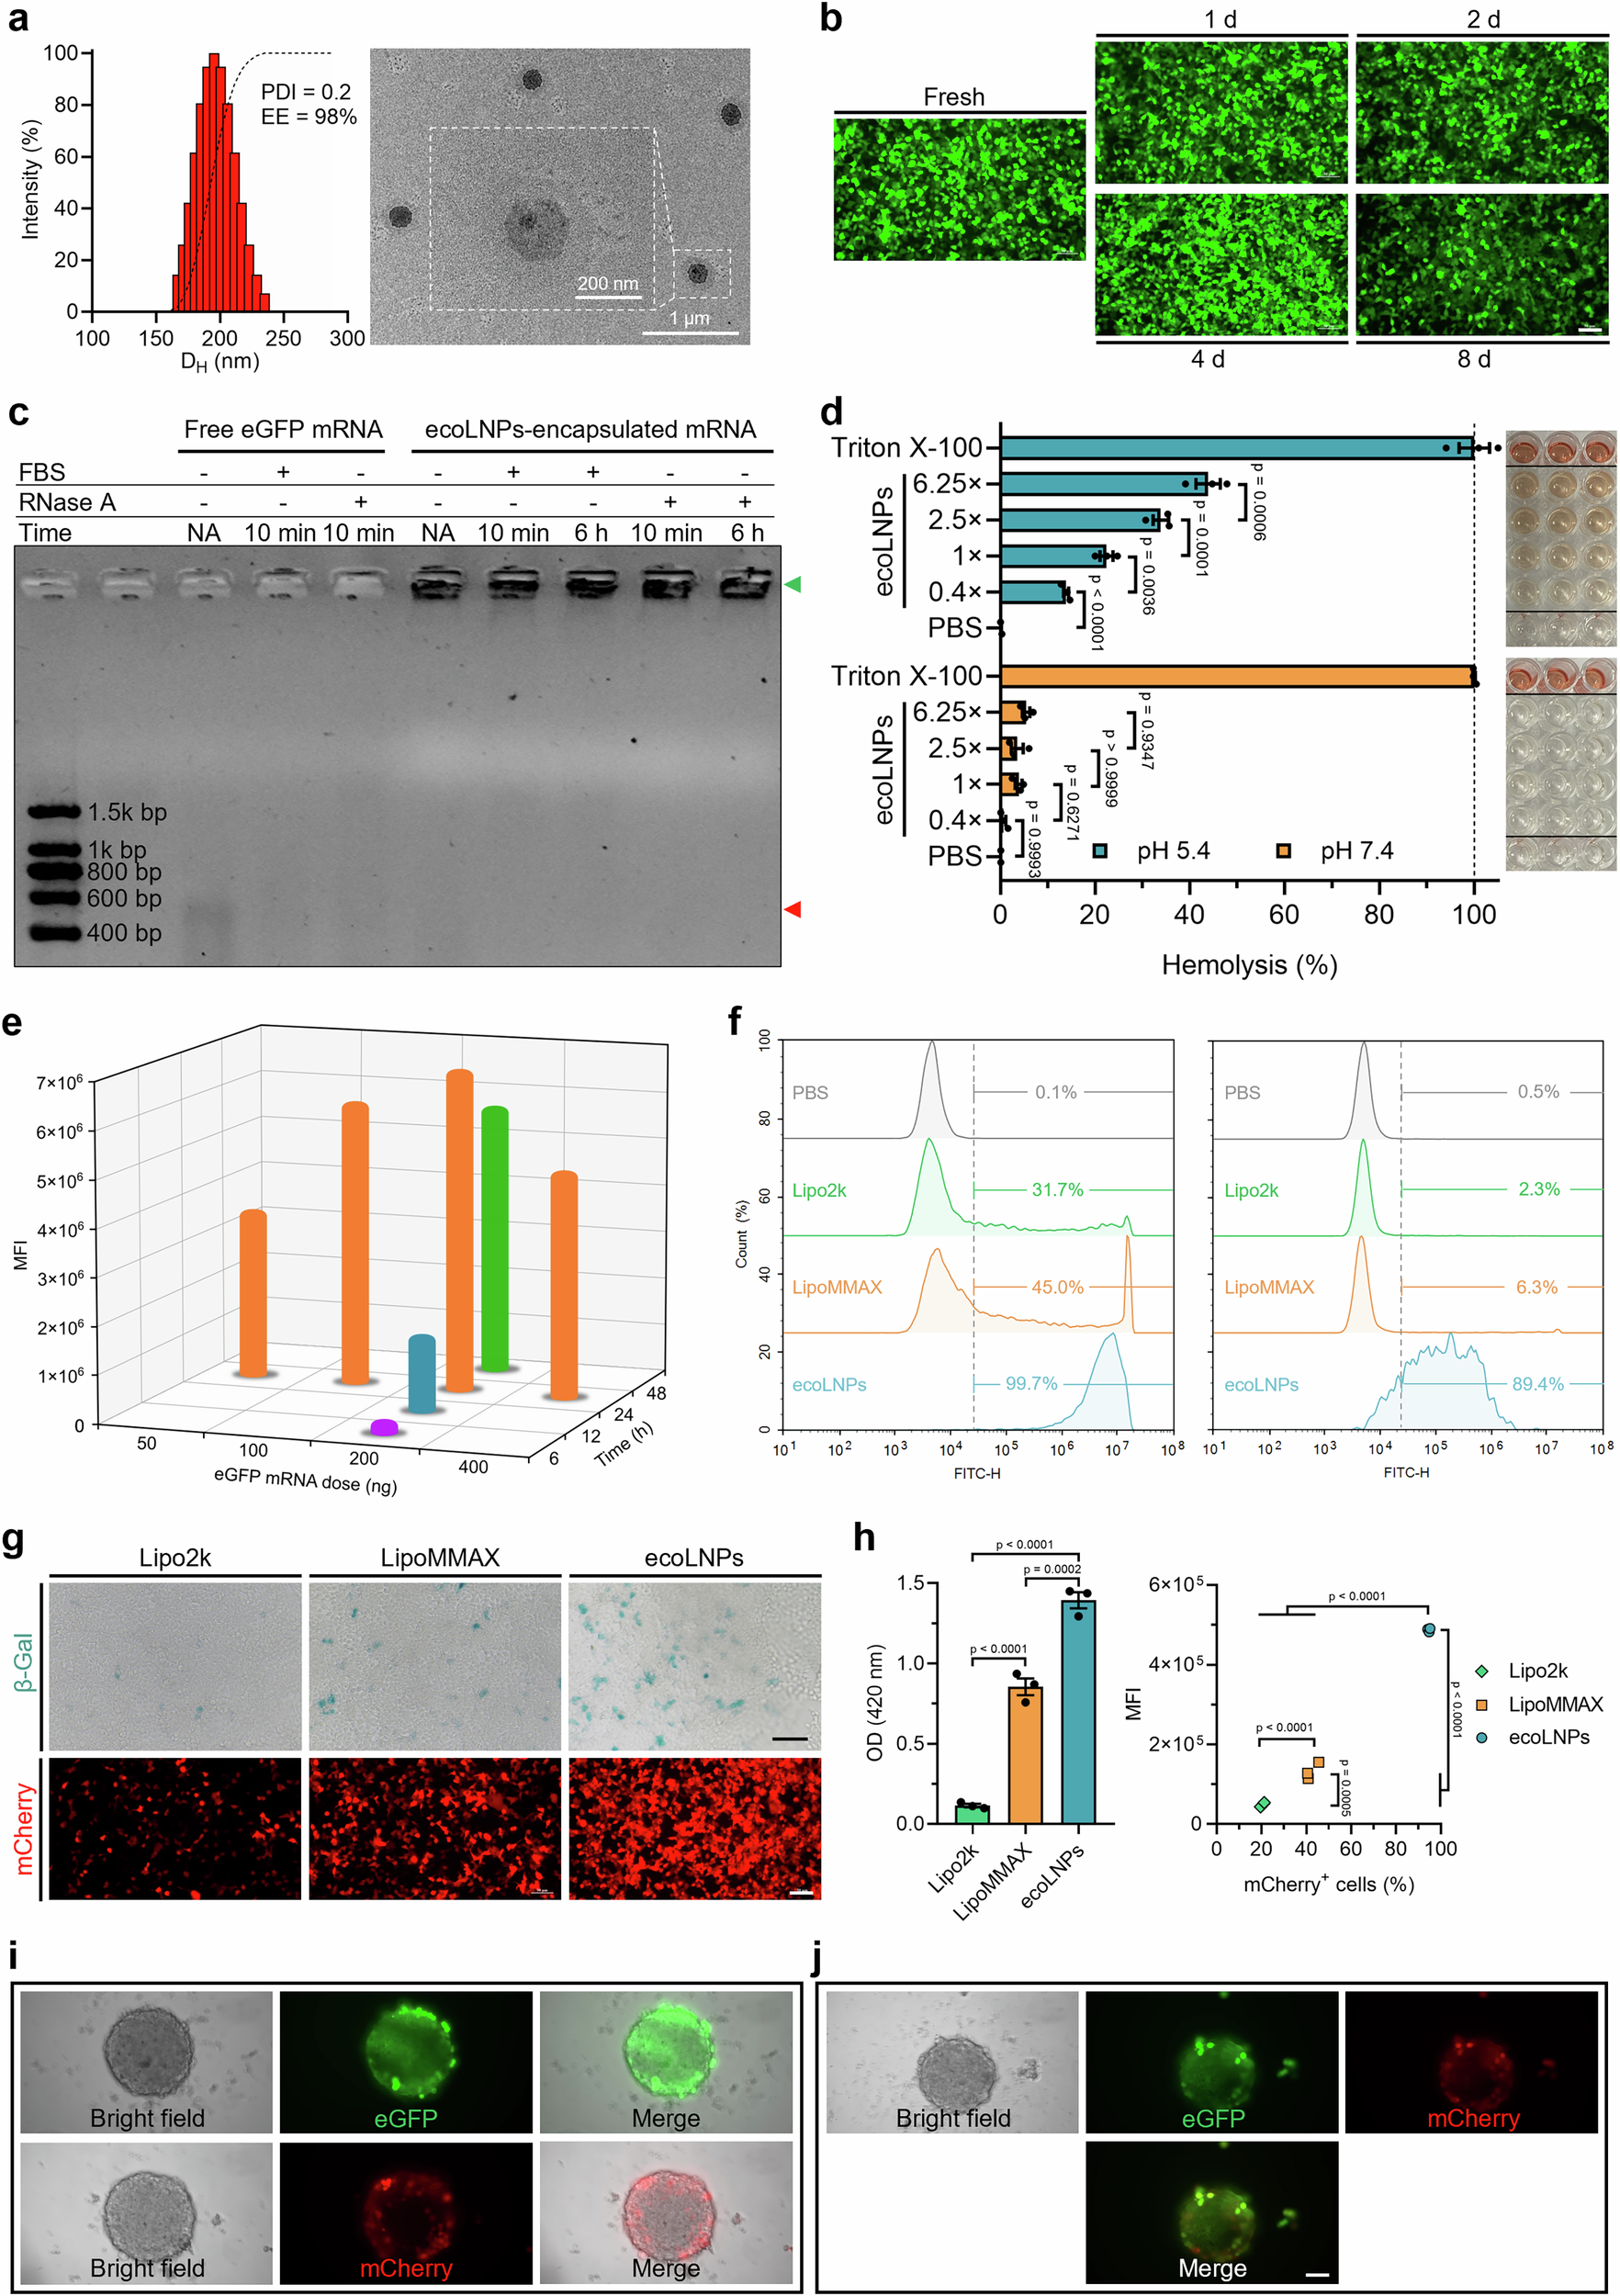
Figure 4 — CF3-2N6-UC18 ecoLNP characterization and cell delivery
ecoLNPs containing the lead CF3-2N6-UC18 lipid are evaluated by LNP morphology, RNA protection, reporter expression and flow cytometry. The gel measures RNA protection; it is not lipid chemical-identification data. 293T and THP-1 cells; reporter-mRNA assays; formulation storage at 4°C; comparator transfection reagents and replicate counts are identified in the source figure.
Liu et al. (2025), Nature Communications, Figure 4. CC BY 4.0. Original figure unchanged. Original article / figure · CC BY 4.0. Unmodified complete original figure; displayed at responsive size.
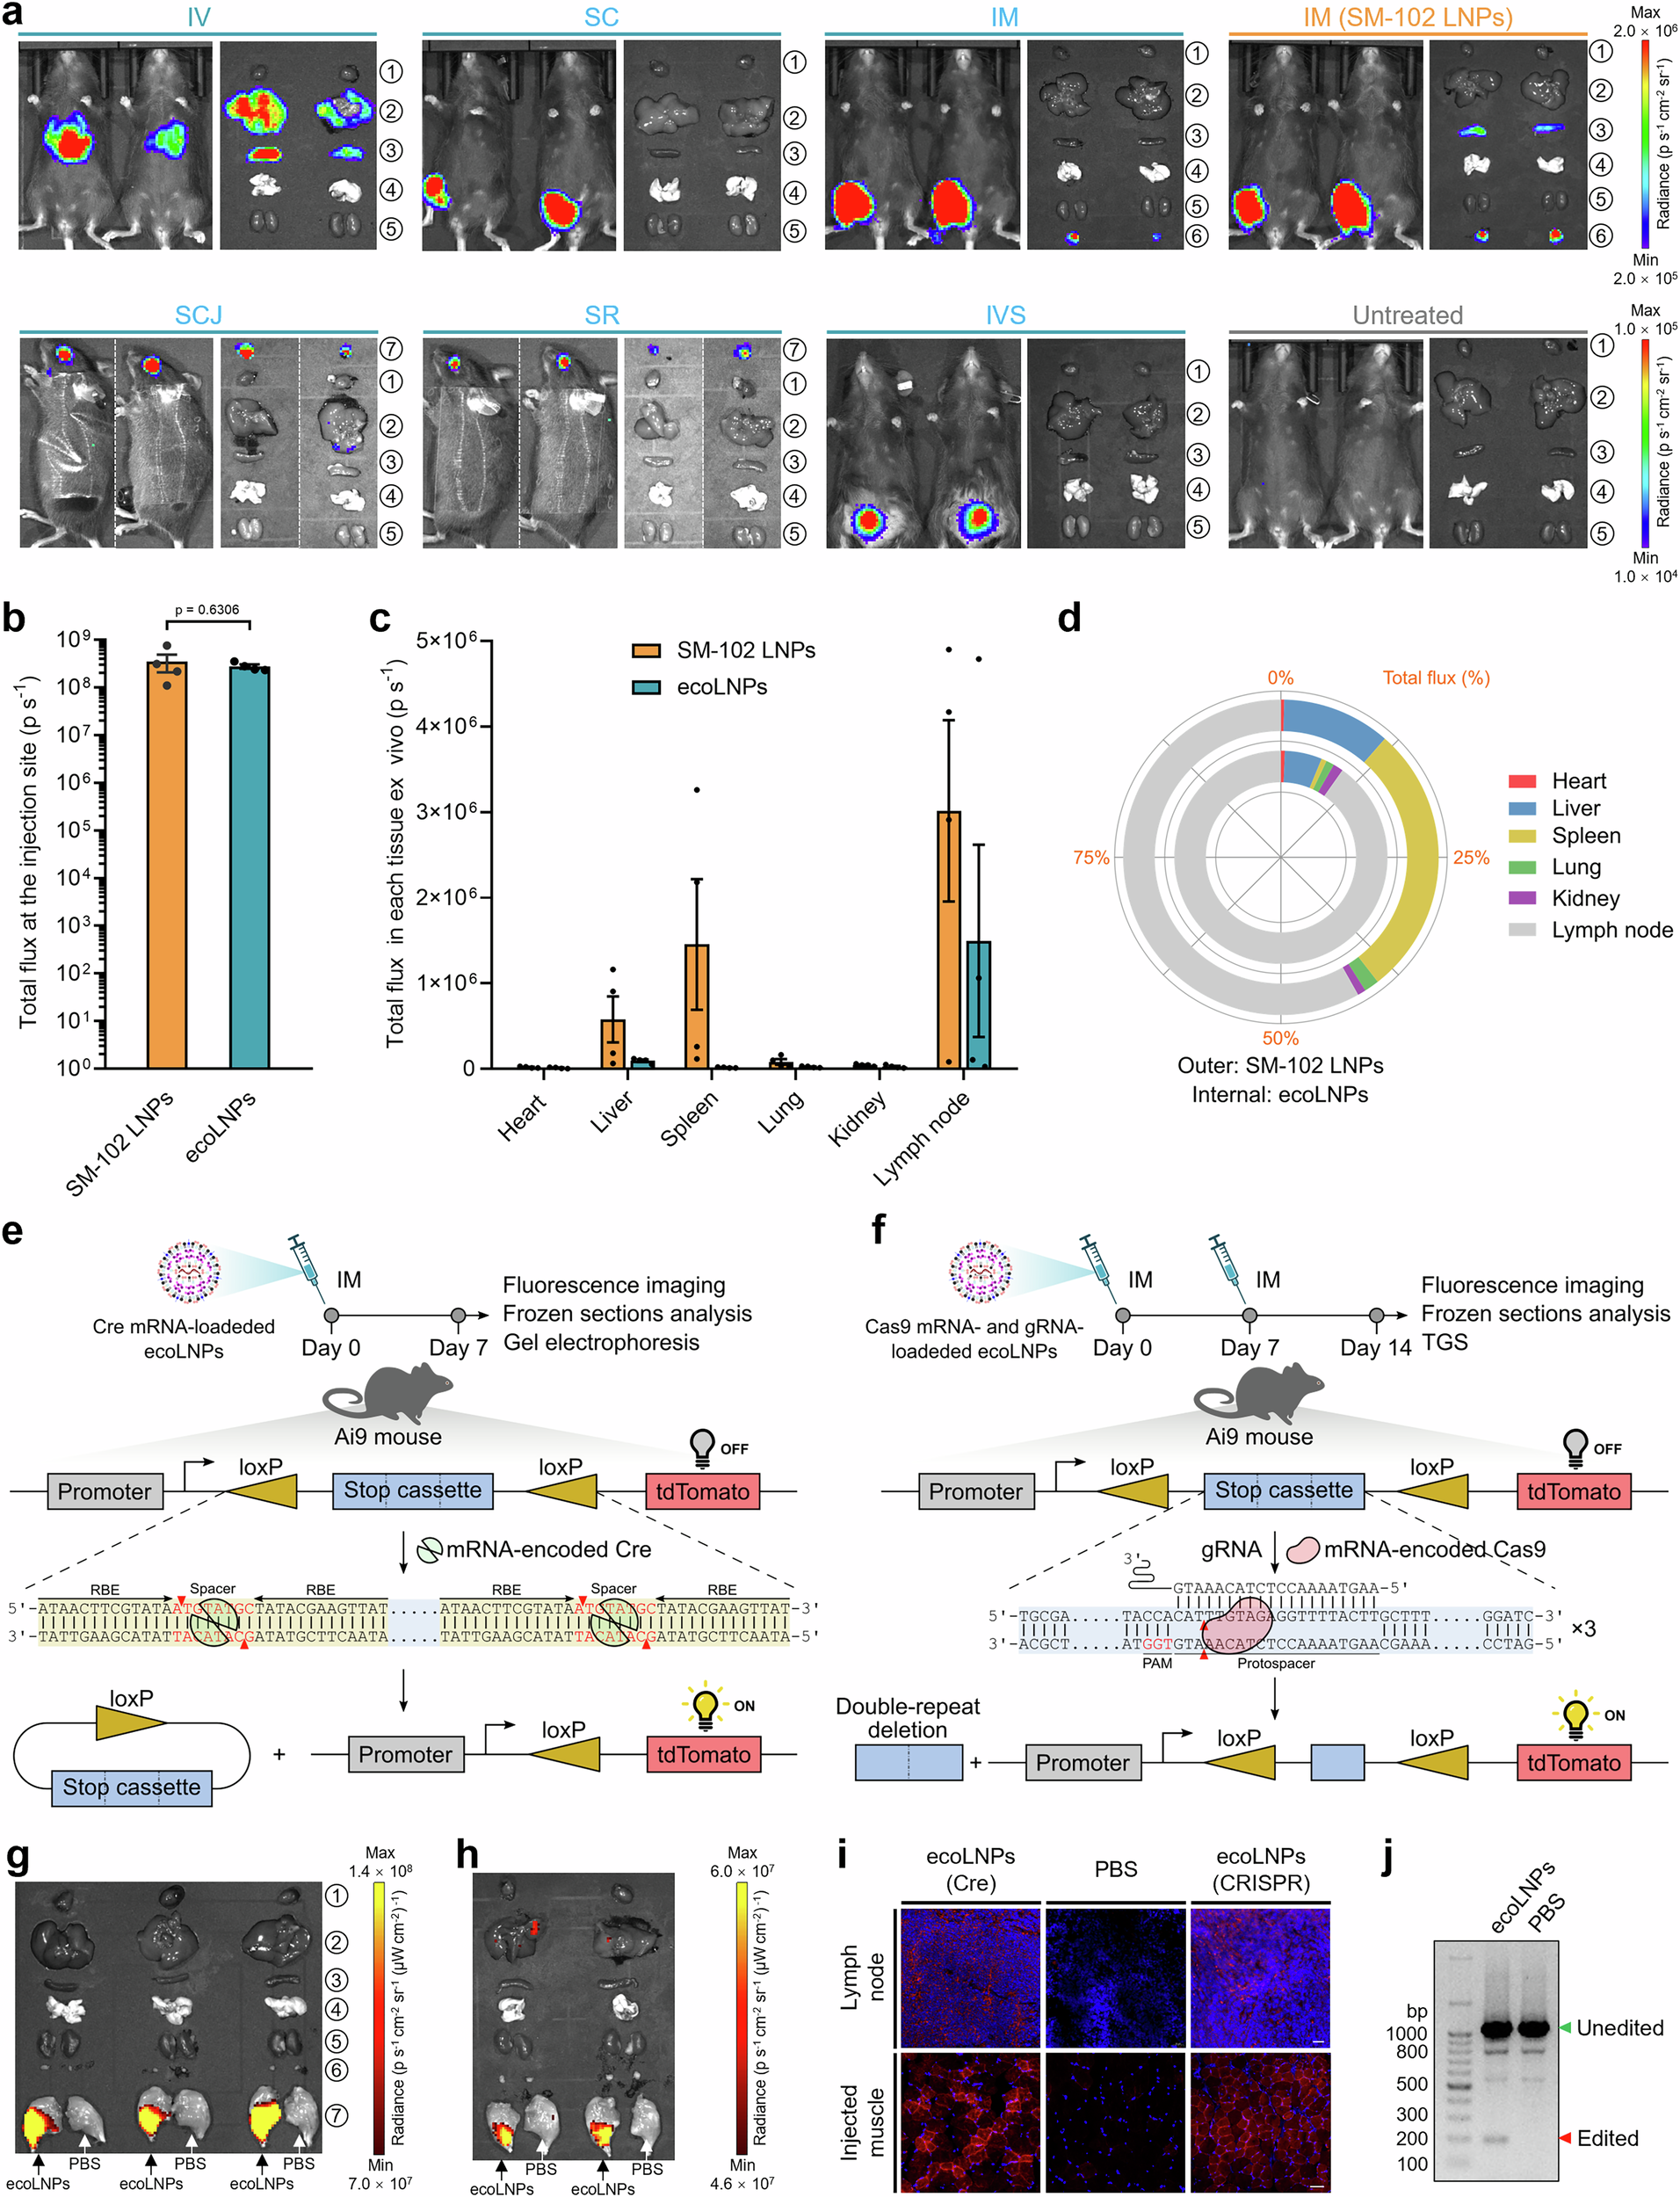
Figure 6 — CF3-2N6-UC18 ecoLNP delivery in mice
The original figure separates route-dependent reporter imaging from Cre/CRISPR reporter-model experiments. The comparison with SM-102 applies to the indicated intramuscular formulation experiment. C57BL/6 reporter imaging at 4 hours; Ai9 reporter-model evaluation at 7 or 14 days; routes, cargos and doses differ across panels.
Liu et al. (2025), Nature Communications, Figure 6. CC BY 4.0. Original figure unchanged. Original article / figure · CC BY 4.0. Unmodified complete original figure; displayed at responsive size.