sales@dcchemicals.com
AA-T3A-C12
Formulation & Performance
Formulation & Performance
Study-specific compositions, preparation conditions and experimental outcomes for AA-T3A-C12.
Main article, complete supplementary information and source-data workbook reviewed. Activated fibroblast / stellate-cell delivery and antifibrotic experiments are separated from whole-liver uptake. Calculations from source data are labeled.
1. Formulations and component amounts
Reported composition and calculated mass are separate. Molecular-weight inputs use catalog values or an explicitly identified reference average; DMG-PEG2000 is fixed initially at 2507. Edit inputs only when using a verified alternative material.
AA-T3A-C12 / siRNA — microfluidic animal formulation
Molar ratio 50:10:38.5:1.5; AA-T3A-C12:RNA mass ratio 10:1. The PEG component is DMPE-PEG2000 ammonium (reference average molecular weight 2693.32), not DMG-PEG2000.Main Methods, LNP formulation; SI Table S1; PEG identity reference 880150.
| Component | Molecular weight | Molar parts | Normalized mol% | Amount (µmol) | Weight (mg) |
|---|---|---|---|---|---|
| AA-T3A-C12 | 50.000 | 62.6460 | 66.3873 | ||
| DSPC | 10.000 | 12.5292 | 9.9000 | ||
| Cholesterol | 38.500 | 48.2375 | 18.6510 | ||
| 14:0 PEG2000 PE | 1.500 | 1.8794 | 5.0618 |
Calculated total: 100.0000 mg lipid. RNA, solvent and process loss are excluded.
The PEG molecular-weight input is a reference average for 14:0 PEG2000 PE, not a measurement of the study batch. Main Methods and materials specify DSPC; a Results sentence says DSPE. The table follows Methods. No catalog link is assigned to the PEG component until the matching catalog chemical fields are reconciled.
How component weights are calculated
For total lipid mass M (mg), molar parts rᵢ and molecular weight MWᵢ: component mass = M × rᵢ × MWᵢ / Σ(r × MW). Component amount (µmol) = component mass (mg) × 1000 / MWᵢ. Molar parts are normalized only for the displayed percentage. The calculation does not infer N/P or RNA dose.
2. Preparation and experimental setup
| Parameter | Reported procedure / limitation | Source |
|---|---|---|
| Lipid / RNA ratio | Ionizable lipid:RNA = 10:1 by mass. N/P is not reported. | Main Methods, LNP formulation |
| Solvents | Lipids in ethanol; RNA in 10 mM citrate buffer, pH 3. | Main Methods |
| Microfluidic mixing | Staggered-herringbone PDMS channel, 4 cm; aqueous 1.8 mL/min and ethanol 0.6 mL/min; total 2.4 mL/min, aqueous:organic 3:1. | Main Methods |
| Buffer exchange / handling | PBS dialysis through 20 kDa membrane for 2 h, followed by 0.22 µm filtration; formulated LNPs stored at 4 °C. This is not a shelf-life specification for neat lipid. | Main Methods |
| Screening preparation | Pipette mixing without dialysis was used for screening; do not treat it as identical to the microfluidic animal preparation. | Main Methods |
| Fibroblast activation | 10 ng/mL TGF-β for 24 h before treatment. | Main Methods |
| Fibrosis model | Male BALB/c mice, 6–8 weeks, 22–25 g; 20% CCl4 in oil, 0.7 µL/g intraperitoneally twice weekly for 4 weeks. | Main Methods |
| Therapy regimen | Beginning in week 3: 5 µg siRNA per mouse intravenously, twice weekly for 2 weeks (four administrations); tissues 2 days after final dose. | Main Methods; Fig. 5a |
3. Particle characterization
| Measurement / batch | Reported result | Evidence context |
|---|---|---|
| AA-T3A-C12 / siRNA diameter | 65.6 ± 1.2 nm | SI Table S1; formulated particle, not neat-lipid specification |
| PDI | 0.018 | SI Table S1 |
| Zeta potential | −1.1 ± 1.5 mV | SI Table S1 |
| Encapsulation efficiency | 87.4 ± 3.8% | SI Table S1 |
| Apparent pKa | 5.72 | SI Table S1 |
| Empty AA-T3A-C12 LNP | 59.3 ± 2.5 nm; PDI 0.021; zeta −0.7 ± 0.9 mV | SI Table S1; distinct from siRNA-loaded batch |
| Non-AA T3A-C12 comparator | 64.9 ± 1.8 nm; encapsulation 33.6 ± 8.5%; pKa 5.81 | SI Table S1; large encapsulation difference complicates ligand-only comparisons |
| MC3 comparator | 60.9 ± 3.4 nm; encapsulation 90.1 ± 2.5% | SI Table S1; cited MC3 pKa 6.44 comes from an earlier study, not a matched measurement here |
4. Performance by experiment
| Experiment and dose | Readout and comparator | Result and source |
|---|---|---|
| GFP silencing in activated fibroblasts 3T3-GFP cells; siGFP 50 nM; 5,000 cells/well; n=3 | Readout: 48 h Comparator: AA-LNP with versus without haloperidol pretreatment (30 µM, 2 h) | Source-data calculation: knockdown 82.31 ± 1.15% without blocker and 49.80 ± 6.87% with blocker (mean ± sample SD).Fig. 2d; source data C10:E10 and F10:H10 |
| Cy5-siRNA uptake / receptor competition Activated 3T3-GFP cells; Cy5-siRNA 50 nM; haloperidol 30 µM for 2 h before LNP | Readout: 6 h Comparator: With versus without receptor blocker | Blockade reduced uptake (reported p<0.001), supporting a sigma-receptor contribution under these conditions.Fig. 3b; Methods |
| Cell preference in coculture Activated 3T3-GFP plus H2.35 hepatocytes, 2.5×10^5 of each; Cy5-siRNA 50 nM | Readout: 6 h Comparator: T3A-C12 and MC3 formulations | AA-LNP favored activated fibroblast uptake over hepatocyte uptake in this mixed-cell model. This is cell uptake, not whole-animal organ targeting.Fig. 3; Methods |
| HSP47 knockdown in activated 3T3 cells siHSP47 50 nM; 5×10^5 cells/well | Readout: 48 h; Western blot Comparator: MC3 / siHSP47 | Approximately 60% reduction for AA-LNP versus approximately 35% for MC3, as reported.Fig. 4d |
| HSP47 knockdown in primary hepatic stellate cells Activated primary HSCs; siHSP47 50 nM | Readout: 48 h; Western blot Comparator: MC3 / siHSP47 | Source-data calculation: 65.48 ± 4.98% for AA-LNP versus 33.77 ± 4.48% for MC3 (n=3; mean ± sample SD).Fig. 4e; source data D7:D9 and E7:E9 |
| Liver accumulation and HSC localization Fibrotic BALB/c mice; Cy5-siRNA 5 µg/mouse intravenously; n=3 | Readout: 1 h Comparator: MC3 formulation | Whole-liver fluorescence did not differ significantly (p=0.443), while AA-LNP showed greater association with αSMA-positive HSC regions. Colocalization is not a fraction of injected dose.Fig. 5b–d |
| In vivo HSP47 knockdown CCl4 fibrosis model; siHSP47 5 µg/mouse IV twice weekly for 2 weeks; animal cohort n=5 | Readout: 2 days after final dose; liver Western blot Comparator: PBS and MC3 / siHSP47 | Authors report approximately 65% HSP47 reduction for AA-LNP and approximately 31% for MC3. Blot quantification uses n=3; do not equate it with the n=5 animal cohort.Fig. 5e–f; Methods |
| Collagen reduction Same four-dose fibrosis regimen; liver histology; n=5 | Readout: 2 days after final dose; Sirius red Comparator: PBS disease control | Source-data calculation: mean collagen-positive area 8.92% (PBS) versus 3.7448% (AA-LNP), a 58.02% relative decrease. This is histological area, not siRNA knockdown percentage.Fig. 6b; source-data groups |
| Tolerability in the fibrosis model AA-LNP / control siGFP under the repeated treatment regimen | Readout: Study endpoint; serum chemistry, cytokines and histology Comparator: PBS fibrotic controls | Control-cargo AA-LNP did not worsen the reported liver injury markers relative to the disease control. This does not establish general or human safety.Main safety results and SI |
Mechanistic evidence
Ligand competition, coculture uptake and HSC colocalization support enhanced delivery to activated fibroblasts / stellate cells. Reduced HSP47 expression accompanies reduced collagen pathology. The markedly different encapsulation of non-AA T3A-C12 limits attribution of every difference solely to the tethered ligand.
5. Interpretation and unresolved details
- 50:10:38.5:1.5 is a molar composition; 10:1 is ionizable lipid:RNA mass, not N/P.
- Keep per-mouse dose 5 µg as reported rather than assigning one exact mg/kg value to all 22–25 g mice.
- Use DSPC per Methods; preserve the DSPE wording discrepancy as a source limitation.
- Do not substitute DMG-PEG2000 (2507) for the reported 14:0 PEG2000 PE.
- Particle and animal results apply to the stated formulation and model, not an analytical release specification for neat AA-T3A-C12.
Results apply to the stated LNP composition, cargo, process, dose, route and model. LNP experimental measurements are not batch-release specifications for the isolated lipid.
6. References and data access
Han X, Gong N, Xue L, et al. Ligand-tethered lipid nanoparticles for targeted RNA delivery to treat liver fibrosis. Nature Communications 14, 75 (2023).
DOI: 10.1038/s41467-022-35637-z
PEG-lipid identity and molecular-weight reference
Download experiment table (CSV) · Open printable Formulation & Performance guide
Revision FP-20261024-b2 · Source review: 24 October 2026 · DC Chemicals
Published study figures
Original publication figures illustrating the cited formulation and biological results. Select an image to view it at full size.
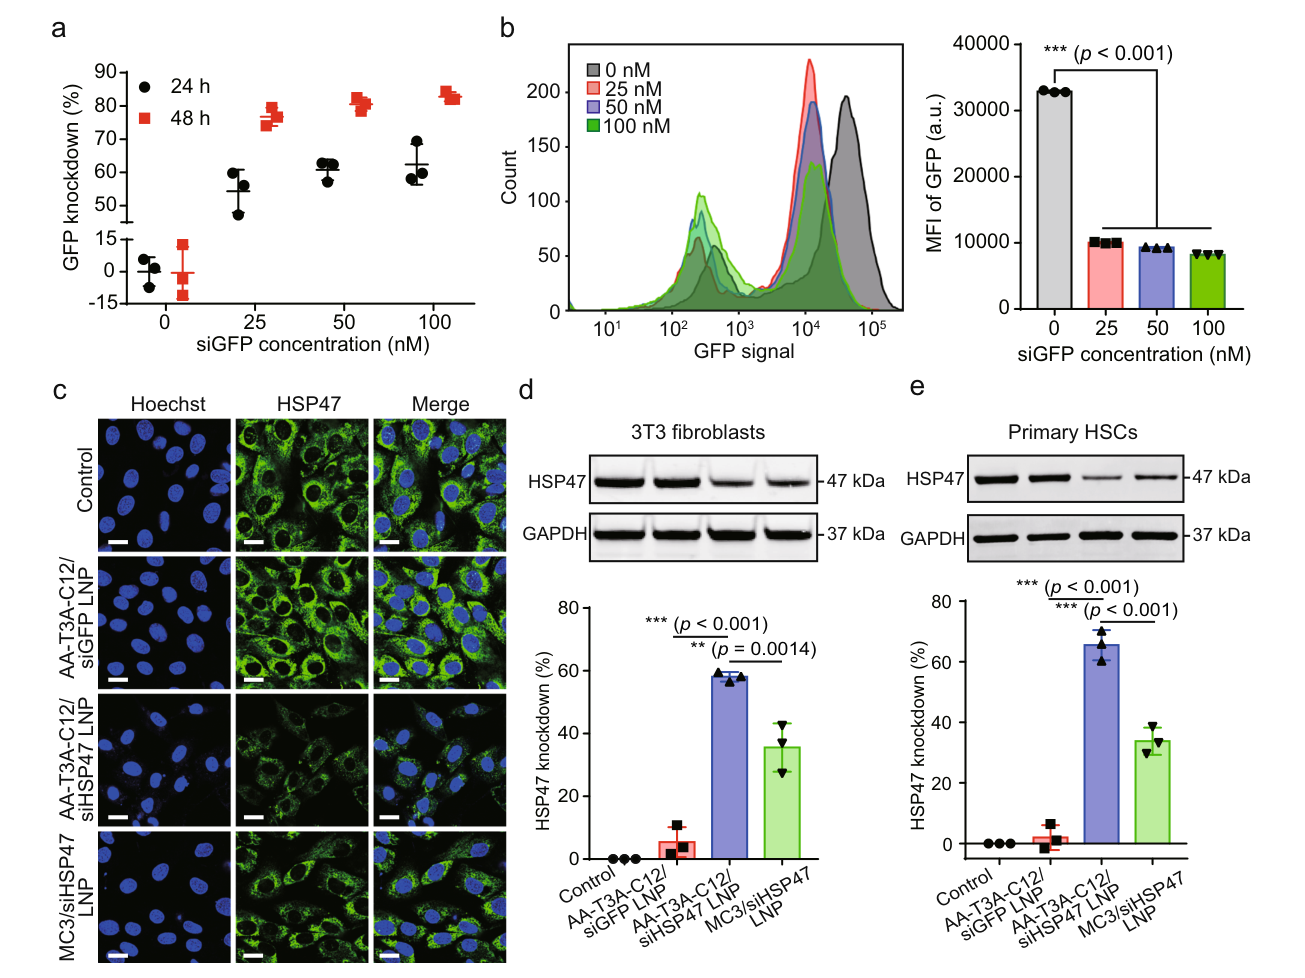
Figure 4a-e — Cellular GFP and HSP47 silencing by AA-T3A-C12 LNPs
Cellular GFP and HSP47 silencing by AA-T3A-C12 LNPs. Activated 3T3 fibroblasts and primary hepatic stellate cells; GFP readouts at 24/48 h; n=3/group.
Han X, Gong N, Xue L, et al. (2023). Ligand-tethered lipid nanoparticles for targeted RNA delivery to treat liver fibrosis. Original article / figure · CC BY 4.0. Complete Figure 4 extracted from page 5 of the author-hosted publisher PDF; surrounding prose/caption omitted. No figure panels, labels or data changed.
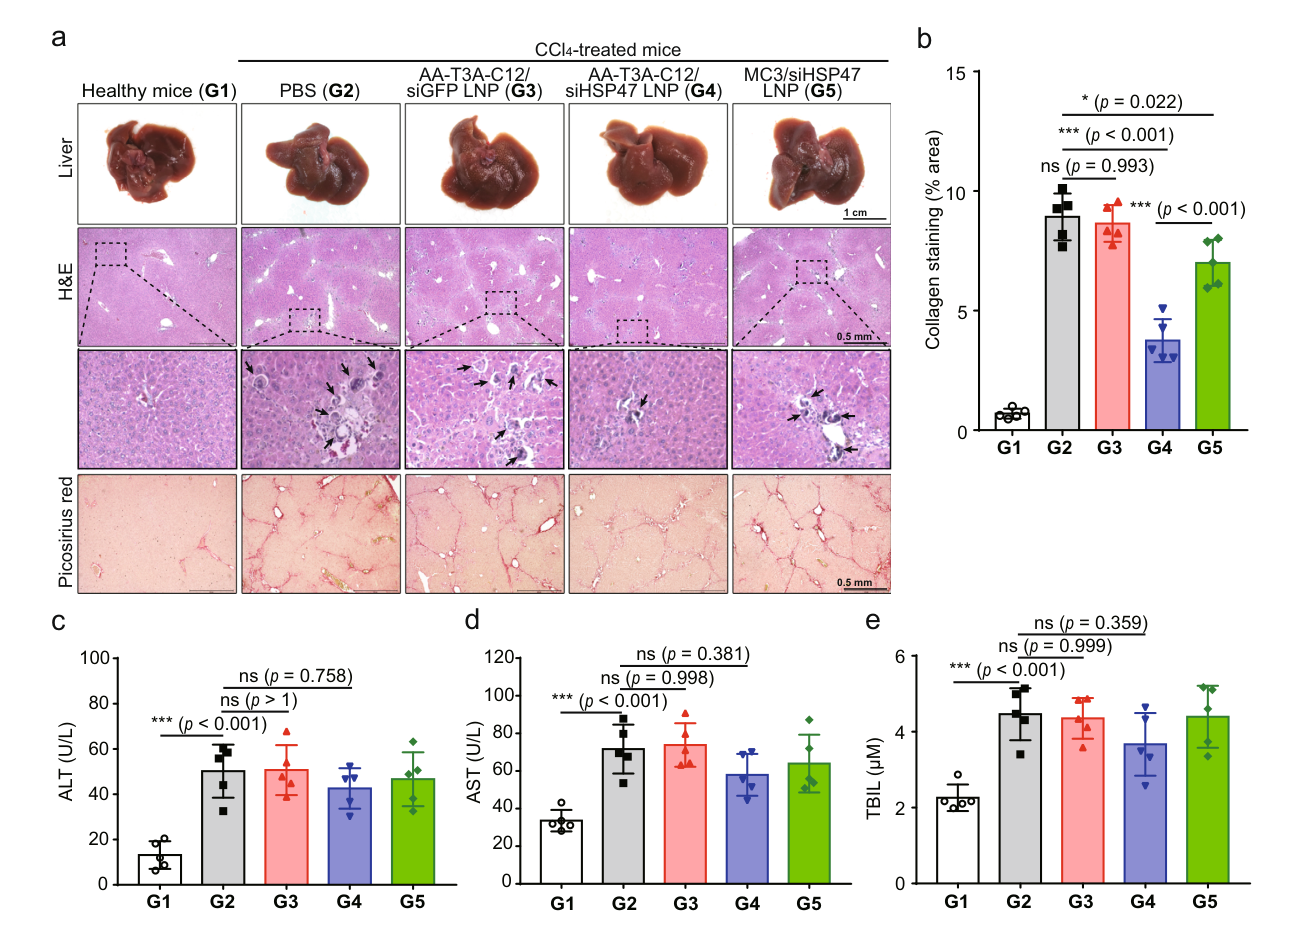
Figure 6a-e — Liver histology, collagen deposition and serum biochemistry in the fibrosis study
Liver histology, collagen deposition and serum biochemistry in the fibrosis study. CCl4-induced mouse liver fibrosis; healthy, PBS, control-siRNA, AA-T3A-C12/siHSP47 and MC3/siHSP47 groups; n=5/group.
Han X, Gong N, Xue L, et al. (2023). Ligand-tethered lipid nanoparticles for targeted RNA delivery to treat liver fibrosis. Original article / figure · CC BY 4.0. Complete Figure 6 extracted from page 8 of the author-hosted publisher PDF; surrounding prose/caption omitted. No figure panels, labels or data changed.