sales@dcchemicals.com
2Ac3-C18
Formulation & Performance
Formulation & Performance
Study-specific compositions, preparation conditions and experimental outcomes for 2Ac3-C18.
Newly checked against the complete Europe PMC article XML, Supplementary Information and author-provided Source Data workbook. Numerical target-specific particle and organ-expression results were recalculated from the original replicate cells; 6Ac1-C12 data are excluded.
1. Formulations and component amounts
Reported composition and calculated mass are separate. Molecular-weight inputs use catalog values or an explicitly identified reference average; DMG-PEG2000 is fixed initially at 2507. Edit inputs only when using a verified alternative material.
B-2 four-component formulation used for 2Ac3-C18 screening
Molar parts (sum 62), not mol%; stated default for subsequent characterization and screening unless otherwise specifiedMain Methods: In vitro screening of nAcx-Cm LNPs for mRNA delivery; In vivo mRNA delivery
| Component | Molecular weight | Molar parts | Normalized mol% | Amount (µmol) | Weight (mg) |
|---|---|---|---|---|---|
| 2Ac3-C18 | 24.194 | 33.0868 | 34.7951 | ||
| DOPE | 32.258 | 44.1157 | 32.8234 | ||
| Cholesterol | 40.323 | 55.1447 | 21.3217 | ||
| DMG-PEG2000 | 3.226 | 4.4116 | 11.0598 |
Calculated total: 100.0000 mg lipid. RNA, solvent and process loss are excluded.
DMG-PEG2000 calculations use the catalog nominal molecular weight 2507.
How component weights are calculated
For total lipid mass M (mg), molar parts rᵢ and molecular weight MWᵢ: component mass = M × rᵢ × MWᵢ / Σ(r × MW). Component amount (µmol) = component mass (mg) × 1000 / MWᵢ. Molar parts are normalized only for the displayed percentage. The calculation does not infer N/P or RNA dose.
2. Preparation and experimental setup
| Parameter | Reported procedure / limitation | Source |
|---|---|---|
| Aqueous phase | mRNA in 10 mM sodium citrate, pH 4.0. | Main Methods: nAcx-Cm LNP formulation and characterization |
| Organic phase and mixing | Lipid components dissolved in ethanol; rapid ethanol-dilution mixing at ethanol:aqueous 1:3 by volume. | Main Methods: nAcx-Cm LNP formulation and characterization |
| Post-mixing incubation | 15 min at room temperature. | Main Methods: nAcx-Cm LNP formulation and characterization |
| Buffer exchange for in vivo use | Dialysis against 1× PBS for 2 h. | Main Methods: nAcx-Cm LNP formulation and characterization |
| Lipid:mRNA loading | 2Ac3-C18:mRNA 10:1 by mass; this refers to the ionizable lipid, not all lipid components and not N/P. | Main Methods: In vitro screening of nAcx-Cm LNPs for mRNA delivery |
| Unreported target-specific parameters | No target-specific apparent particle pKa or N/P was verified. The exact 2Ac3-C18 organ-screen dose is not explicitly specified in the corresponding figure caption or method. | Main Fig. 4d–e; SI Fig. S13; Methods |
3. Particle characterization
| Measurement / batch | Reported result | Evidence context |
|---|---|---|
| Hydrodynamic diameter | 75.13 ± 1.45 nm | Calculated mean ± sample SD, n = 3; Source Data, Figure 3, C4:C6 |
| PDI | 0.126 ± 0.029 | Calculated mean ± sample SD, n = 3; Source Data, Figure 3, C8:C10 |
| Zeta potential | −7.36 ± 1.62 mV | Calculated mean ± sample SD, n = 3; Source Data, Supplementary Fig. 9, D3:F3 |
| mRNA binding efficacy | 85.00 ± 4.36% | Author endpoint name retained; calculated mean ± sample SD, n = 3; Source Data, Supplementary Fig. 9, C29:E29. Not relabelled as encapsulation efficiency. |
4. Performance by experiment
| Experiment and dose | Readout and comparator | Result and source |
|---|---|---|
| In vitro luciferase screening IGROV1 cells, seeded at 1.5 × 10⁴ cells/well; 25 ng Fluc mRNA/well; B-2 formulation; n = 3 | Readout: Luciferase measurement time not explicitly stated in this method Comparator: Parallel nAcx-Cm lipid library formulations | 2Ac3-C18 was active in the library screen. The source records 739250, 721641 and 70369 RLU, showing substantial between-replicate variation; these values do not establish it as the strongest lipid in the library.Main Fig. 2e–f; Source Data, Figure 2, BW4:BW6; Methods |
| Intravenous organ-expression screen C57BL/6 mice; Fluc mRNA; B-2 formulation; n = 3; exact target-specific dose not explicitly reported | Readout: 6 h Comparator: Other nAcx-Cm formulations and positive-control LNPs in the organ screen; within-animal organ comparison | 2Ac3-C18 favoured spleen expression: spleen 671333 ± 103016 versus liver 90033 ± 12693 photons/s/cm²/sr (calculated mean ± sample SD). These are organ reporter signals, not biodistribution or a T-cell transfection measurement.Main Fig. 4d–e; SI Fig. S13; Source Data, Figure 4, L9:N9 and I9:K9 |
| Cell-viability library screen IGROV1 cells; alamarBlue assay; n = 3; precise viability dose and time not separately stated | Readout: Not separately stated for this endpoint Comparator: Normalized viability reference and parallel lipid library | 2Ac3-C18 normalized viability was 105.05 ± 7.38% (calculated mean ± sample SD). Values above 100% are assay-normalized signals, not evidence of a therapeutic proliferative effect.SI Fig. S7; Source Data, Supplementary Fig. 7, D41:F41; Methods |
Mechanistic evidence
2Ac3-C18 is a member of the branched nAcx-Cm ionizable-lipid library. The target-specific four-component formulation favoured splenic luciferase expression in the mouse organ screen. The paper’s detailed reformulation work with 6Ac1-C12 does not establish the same lung-targeting mechanism, cellular distribution or stability for 2Ac3-C18.
5. Interpretation and unresolved details
- The 15:20:25:2 recipe is a molar-parts ratio and must be normalized before reporting molar percentages. The 10:1 loading ratio uses the ionizable lipid mass only.
- All calculated means and SDs identify their original workbook cells; they are recalculations from author data rather than new experiments or lot-release measurements.
- The organ screen supports splenic reporter expression. It does not establish splenic cell-subset targeting, T-cell-engager delivery or a fluorescent biodistribution percentage.
- The 0.25 mg/kg dose explicitly reported for the lung-targeting and formulation-optimization studies is not assigned to the separate 2Ac3-C18 organ screen without a target-specific source.
- Particle pKa, long-term storage results, 3-/4-/5-component lung formulations and detailed in vivo toxicity results for 5Ac1-C12 or 6Ac1-C12 are not transferred to 2Ac3-C18.
- Published mRNA binding efficacy is retained as its original assay endpoint; it is not automatically interchangeable with an encapsulation-efficiency assay.
Results apply to the stated LNP composition, cargo, process, dose, route and model. LNP experimental measurements are not batch-release specifications for the isolated lipid.
6. References and data access
Su K, et al. Reformulating lipid nanoparticles for organ-targeted mRNA accumulation and translation. Nature Communications. 2024;15:5659. doi:10.1038/s41467-024-50093-7.
DOI: 10.1038/s41467-024-50093-7
Download experiment table (CSV) · Open printable Formulation & Performance guide
Revision FP-20261024-b2 · Source review: 24 October 2026 · DC Chemicals
Published study figures
Original publication figures illustrating the cited formulation and biological results. Select an image to view it at full size.
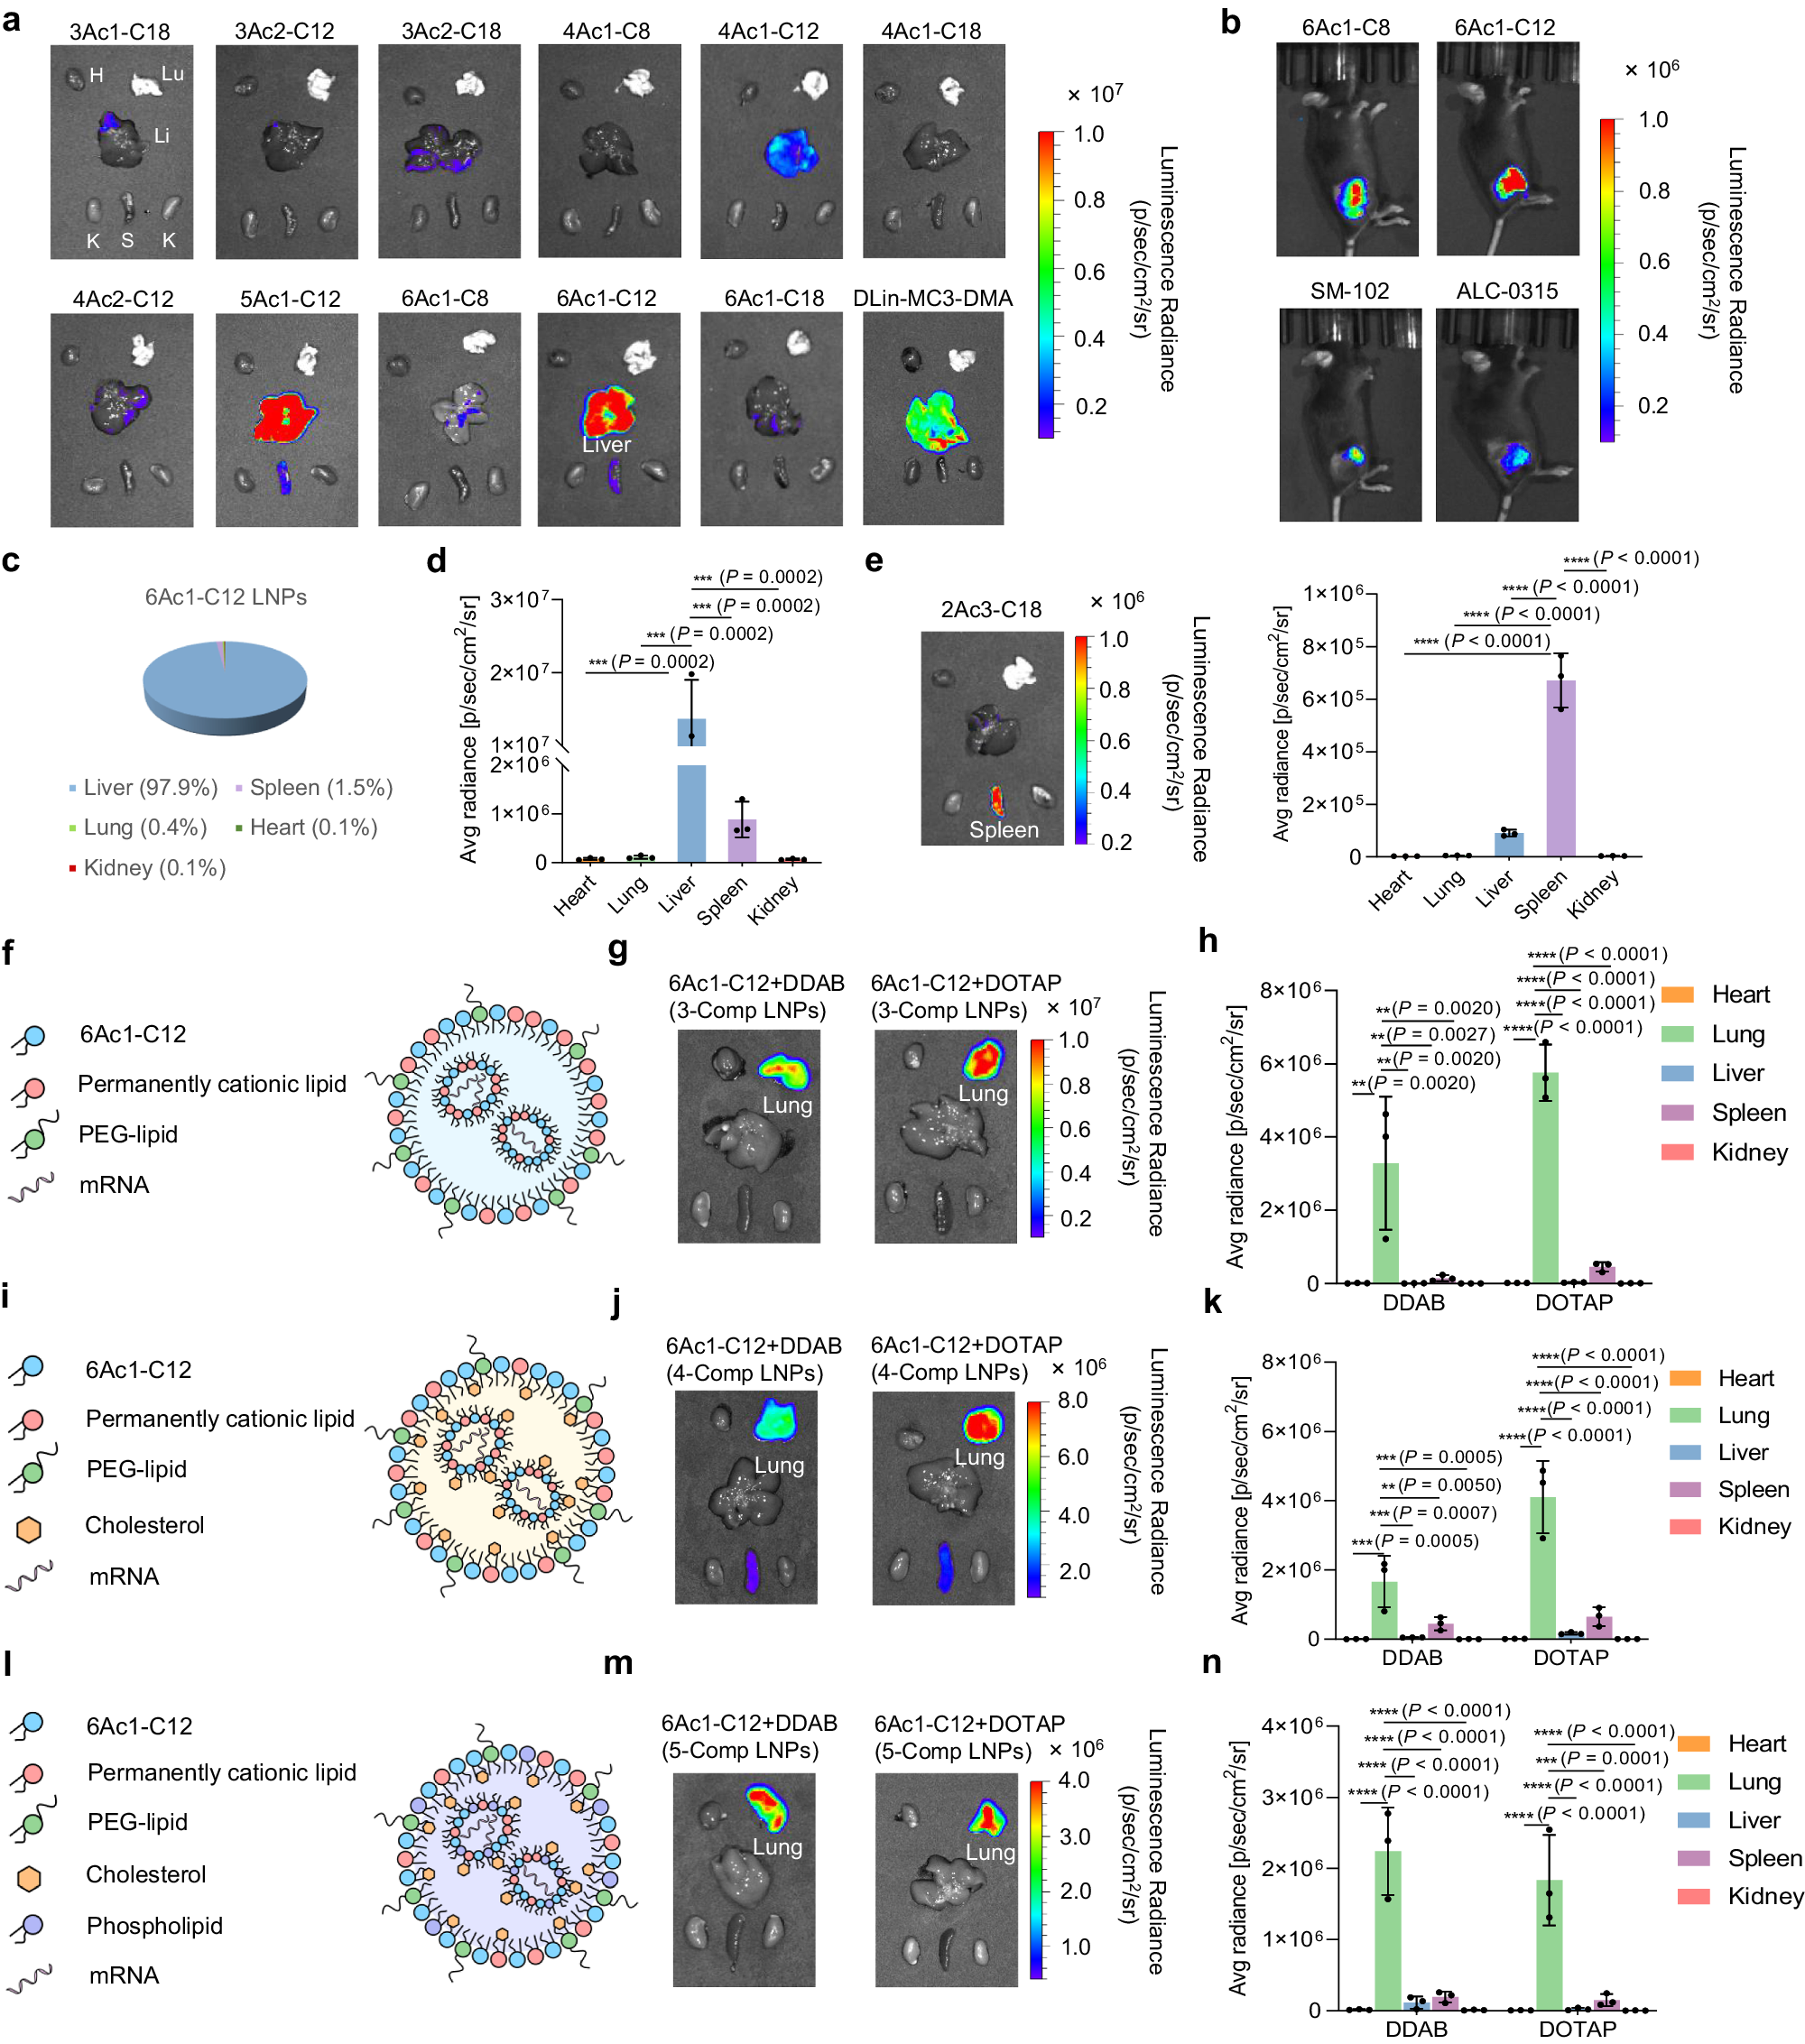
Figure 4 — Formulation-dependent organ expression
6Ac1-C12 liver and lung formulations are shown in separate panels. Only panel e reports 2Ac3-C18 spleen-selective expression; the 6Ac1-C12 lung results must not be attributed to 2Ac3-C18. Mouse reporter-mRNA studies; route and formulation differ by panel; n=3 biologically independent animals. See the study formulation table for the recipe corresponding to each panel.
Su et al. (2024), Nature Communications, Figure 4. CC BY 4.0. Original figure unchanged. Original article / figure · CC BY 4.0. Unmodified complete original figure; displayed at responsive size.