sales@dcchemicals.com
lipid 11-10-8
Formulation & Performance
Formulation & Performance
Study-specific compositions, preparation conditions and experimental outcomes for 11-10-8.
Full article and SI reviewed; crude F1 screening, purified F5 optimization, mRNA therapy and siRNA outcomes are separated.
1. Formulations and component amounts
Reported composition and calculated mass are separate. Molecular-weight inputs use the current catalog values; DMG-PEG2000 is fixed initially at 2507. Edit inputs only when using a verified alternative material.
F1, crude screening
mol%SI Table S3
| Component | Molecular weight | Molar parts | Normalized mol% | Amount (µmol) | Weight (mg) |
|---|---|---|---|---|---|
| 11-10-8 | 36.800 | 60.5774 | 41.1381 | ||
| DOPE | 21.000 | 34.5686 | 25.7201 | ||
| Cholesterol | 40.400 | 66.5034 | 25.7135 | ||
| DMG-PEG2000 | 1.800 | 2.9630 | 7.4283 |
Calculated total: 100.0000 mg lipid. RNA, solvent and process loss are excluded.
F5, purified optimized
mol%SI Table S3; selected calculation basis
| Component | Molecular weight | Molar parts | Normalized mol% | Amount (µmol) | Weight (mg) |
|---|---|---|---|---|---|
| 11-10-8 | 40.000 | 70.0313 | 47.5582 | ||
| DOPE | 10.000 | 17.5078 | 13.0263 | ||
| Cholesterol | 48.500 | 84.9129 | 32.8316 | ||
| DMG-PEG2000 | 1.500 | 2.6262 | 6.5838 |
Calculated total: 100.0000 mg lipid. RNA, solvent and process loss are excluded.
How component weights are calculated
For total lipid mass M (mg), molar parts rᵢ and molecular weight MWᵢ: component mass = M × rᵢ × MWᵢ / Σ(r × MW). Component amount (µmol) = component mass (mg) × 1000 / MWᵢ. Molar parts are normalized only for the displayed percentage. The calculation does not infer N/P or RNA dose.
2. Preparation and experimental setup
| Parameter | Reported procedure / limitation | Source |
|---|---|---|
| Initial screen | Pipette mixing; lipid ethanol phase and mRNA in 10 mM citrate, pH 3; ethanol:aqueous 1:3. | Methods: LNP formulation and optimization |
| Screening mass recipe | Lipidoid:DOPE:cholesterol:DMG-PEG:mRNA = 16:10:10:3:1.6 by mass; reported encapsulation typically 40–80%. | Methods; distinct from molar table |
| Optimized assembly | Microfluidic mixing; ethanol:aqueous flow ratio 1:3; 11-10-8:mRNA 10:1 by mass. Total flow and N/P are not reported here. | Methods |
| Purification | 20 kDa dialysis against 1× PBS for 2 h; 0.22 µm filtration; stored at 4 °C. | Methods |
| Benchmark recipe | MC3 or SM-102 / DSPC / cholesterol / DMG-PEG = 50:10:38.5:1.5; reported MC3:mRNA mass ratio 10:1. | Methods; different helper composition from F5 |
3. Particle characterization
| Measurement / batch | Reported result | Evidence context |
|---|---|---|
| Purified F5 | Approximately 71.2 nm; PDI 0.087; encapsulation approximately 95%; zeta potential −1.09 mV | Fig. 4d |
| Apparent LNP pKa | 6.22 by TNS assay | Fig. 4 / characterization |
| Recipe discrepancy | SI F5 cholesterol 48.5%; Methods text says 48.8, producing a total of 100.3 | SI Table S3 versus Methods; 48.5 is used explicitly for calculations |
4. Performance by experiment
| Experiment and dose | Readout and comparator | Result and source |
|---|---|---|
| Initial cell screen HepG2; 5,000 cells/well; Fluc mRNA 15 ng/well | Readout: 24 h Comparator: Library formulations and assay controls | Screening used crude material and the screening recipe. These data are not treated as the purified-F5 outcome.Methods; initial-screen figures |
| Liver reporter expression C57BL/6 mice; intravenous Fluc mRNA 0.1 mg/kg | Readout: 4 h Comparator: MC3 LNP | F5 gave 4.8-fold higher reported liver luciferase expression.Fig. 5a; n=3, mean ± SD |
| TTR genome editing Female mice; intravenous total RNA 1 mg/kg; Cas9 mRNA:TTR sgRNA 4:1 by mass | Readout: Day 7 Comparator: MC3 LNP under the study comparison | Approximately 30% versus 7% liver indels; approximately 50% versus 17% serum TTR reduction. Editing and protein reduction are distinct endpoints.Fig. 5c–d; n=5 |
| FGF21 expression High-fat-diet obese male mice; intravenous FGF21 mRNA 0.25 mg/kg | Readout: Peak at 12 h; exposure followed through 48 h Comparator: MC3 LNP | Peak human FGF21 58.8 ± 1.1 ng/mL; approximately fivefold above MC3. Reported 0–48 h exposure AUC was 4.6-fold greater.Fig. 6a; n=4 |
| FGF21 treatment High-fat-diet obese mice; intravenous 0.25 mg/kg every other day for three doses | Readout: Day 6 and corresponding histology endpoint Comparator: PBS and MC3-based FGF21 arms | Reduced body/liver weight and improved liver steatosis were assessed separately; this is a short preclinical treatment study.Fig. 6b–g; n=4 |
| siRNA potency Intravenous TTR siRNA dose response, 0.02–1 mg/kg | Readout: Day 3 serum TTR Comparator: MC3 LNP | Reported ED50 approximately 0.029 versus 0.030 mg/kg: comparable siRNA potency, despite the mRNA advantage.SI siRNA experiment; main Discussion |
5. Interpretation and unresolved details
- F1 contains crude lipidoid and differs in composition from purified F5. Do not combine their encapsulation or expression values.
- The 48.5/48.8 cholesterol inconsistency is displayed rather than silently reconciled.
- mRNA expression superiority does not establish siRNA superiority.
- LNP-specific short-term tolerability is not a general safety guarantee.
Results apply to the stated LNP composition, cargo, process, dose, route and model. LNP experimental measurements are not batch-release specifications for the isolated lipid.
6. References and data access
Han X, Xu J, Xu Y, et al. In situ combinatorial synthesis of degradable branched lipidoids for systemic delivery of mRNA therapeutics and gene editors. Nature Communications. 2024;15:1762. doi:10.1038/s41467-024-45537-z
DOI: 10.1038/s41467-024-45537-z
Download experiment table (CSV) · Open printable Formulation & Performance guide
Revision FP-20261022 · Source review: 22 October 2026 · DC Chemicals
Published study figures
Original publication figures illustrating the cited formulation and biological results. Select an image to view it at full size.
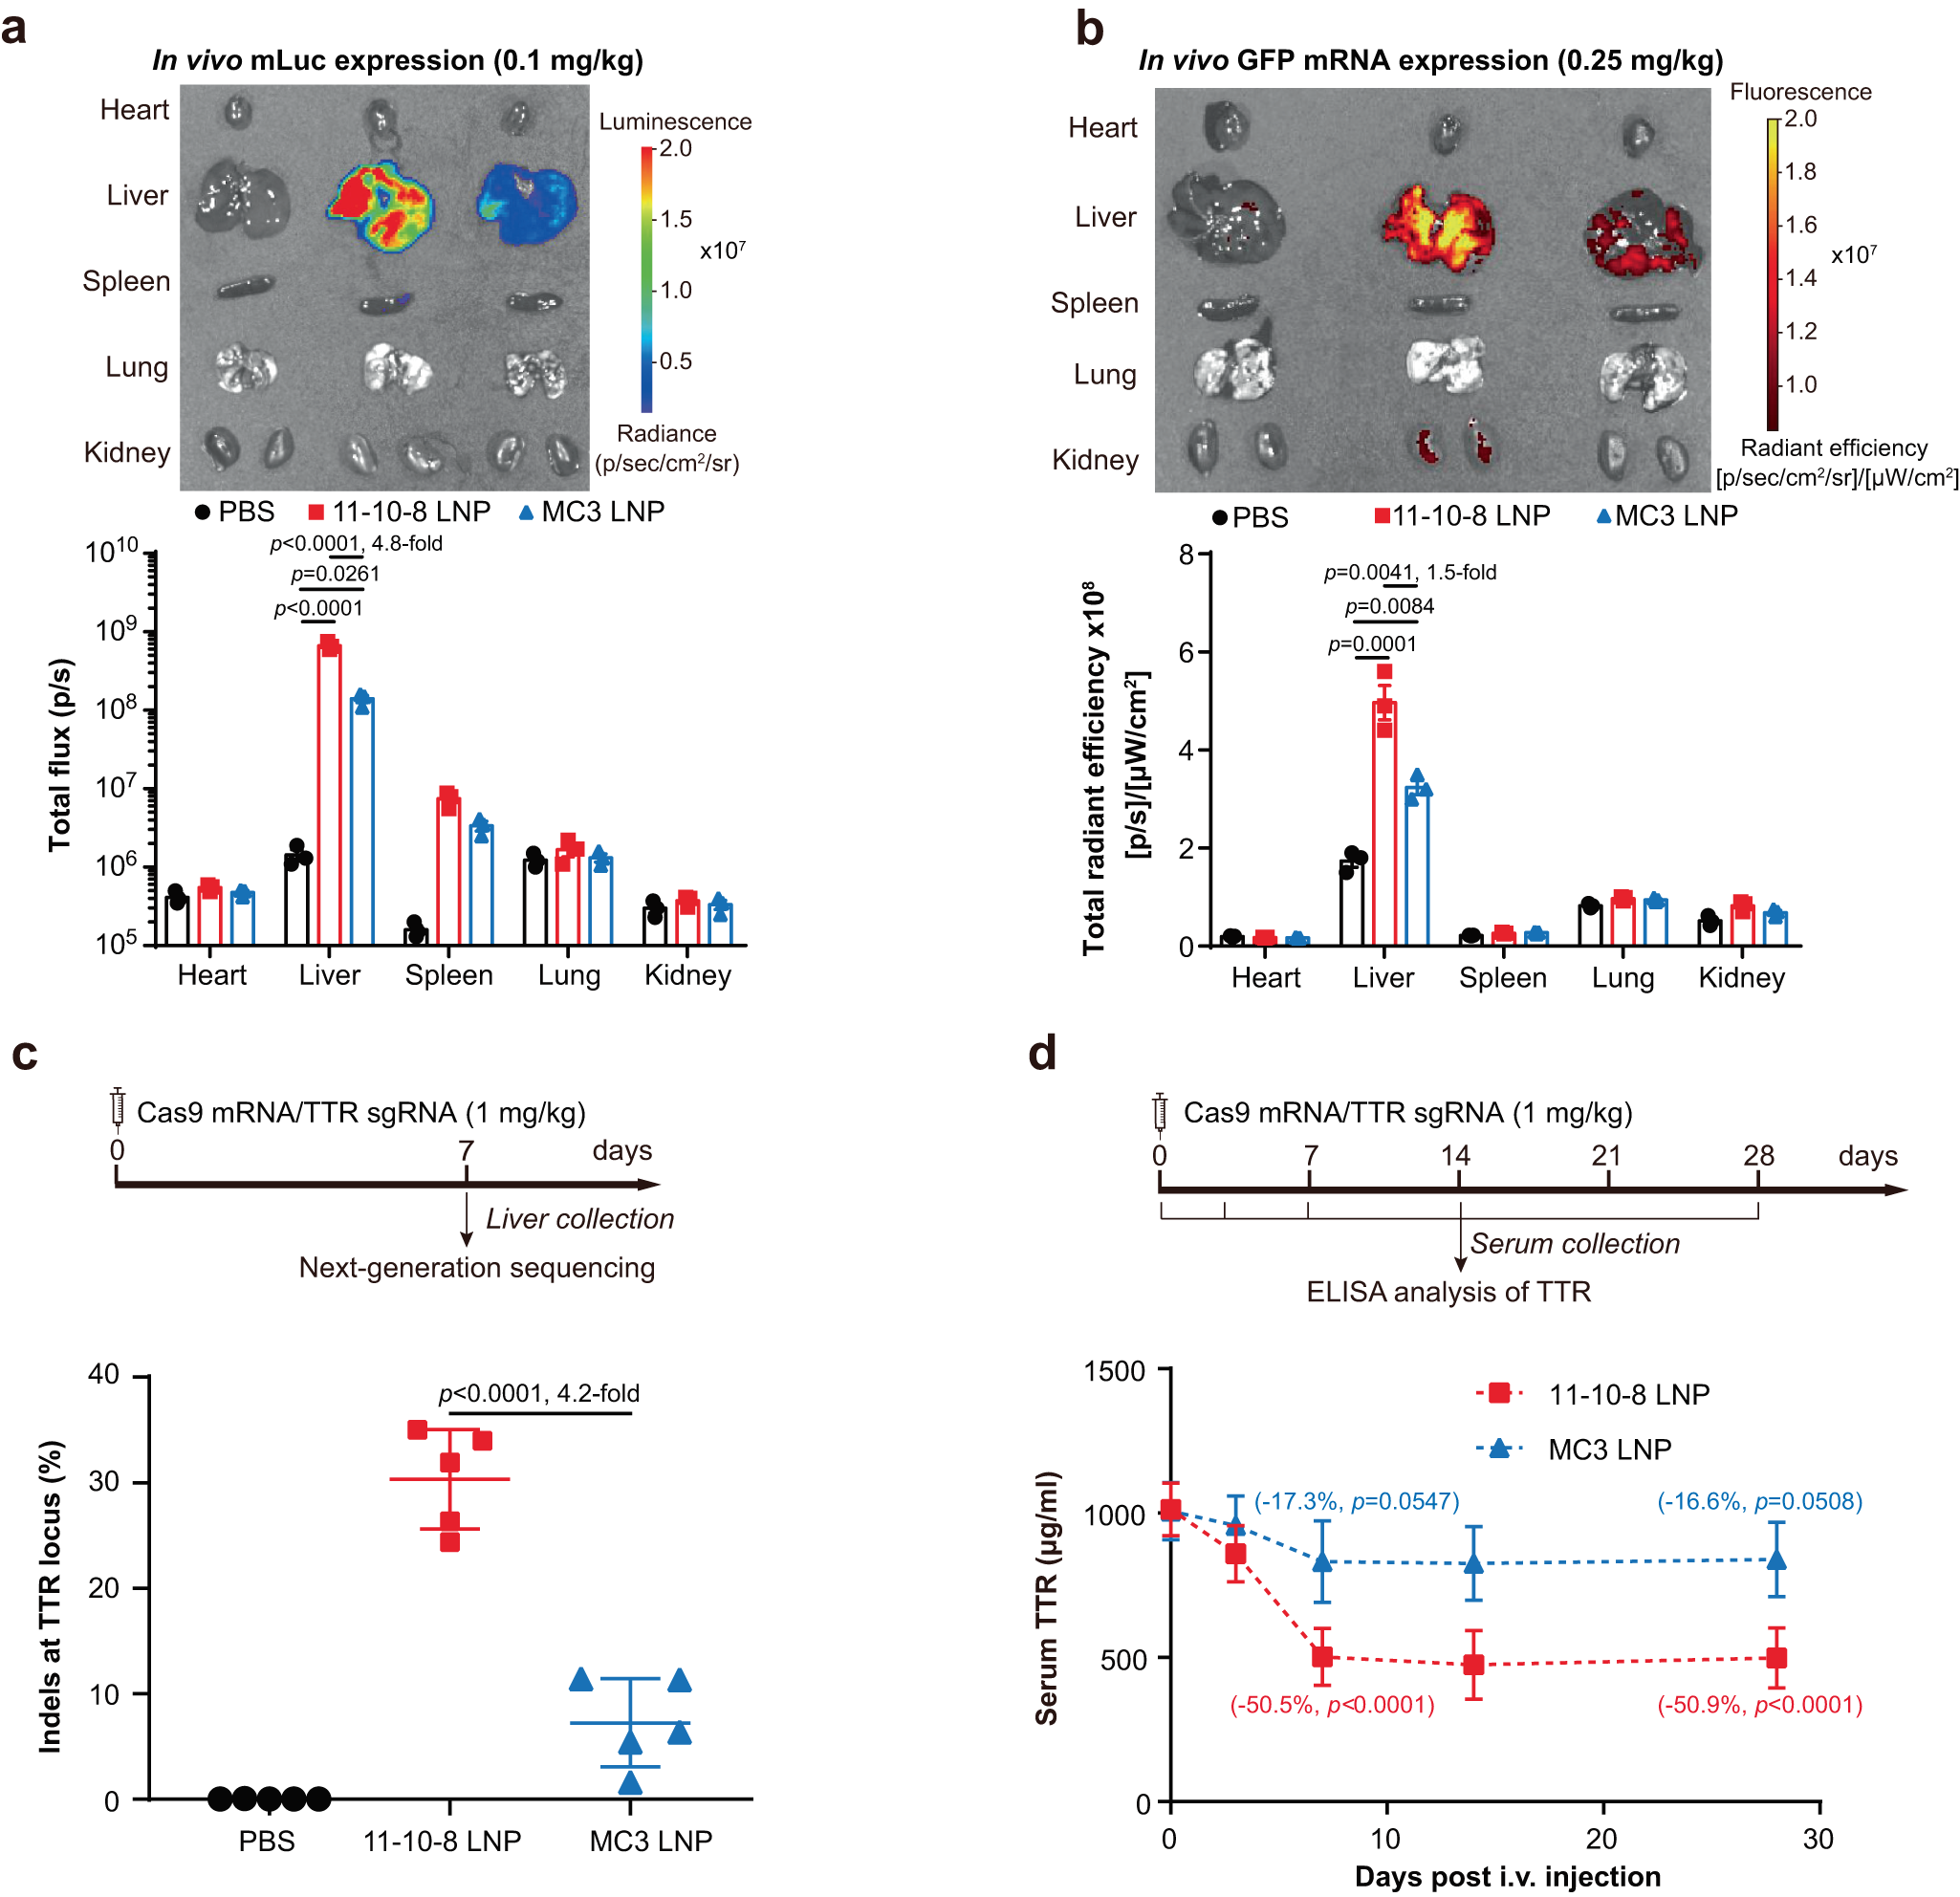
Figure 5 — 11-10-8 hepatic reporter delivery and editing
11-10-8 LNPs and MC3 LNPs are compared using liver reporter expression, TTR-locus indels and serum TTR. Reporter delivery and editing are separate experiments with different cargos and doses. IV administration in mice; reporter imaging at 4 hours; editing endpoint at day 7; n=3 for reporter studies and n=5 for editing/TTR studies.
Han et al. (2024), Nature Communications, Figure 5. CC BY 4.0. Original figure unchanged. Original article / figure · CC BY 4.0. Unmodified complete original figure; displayed at responsive size.
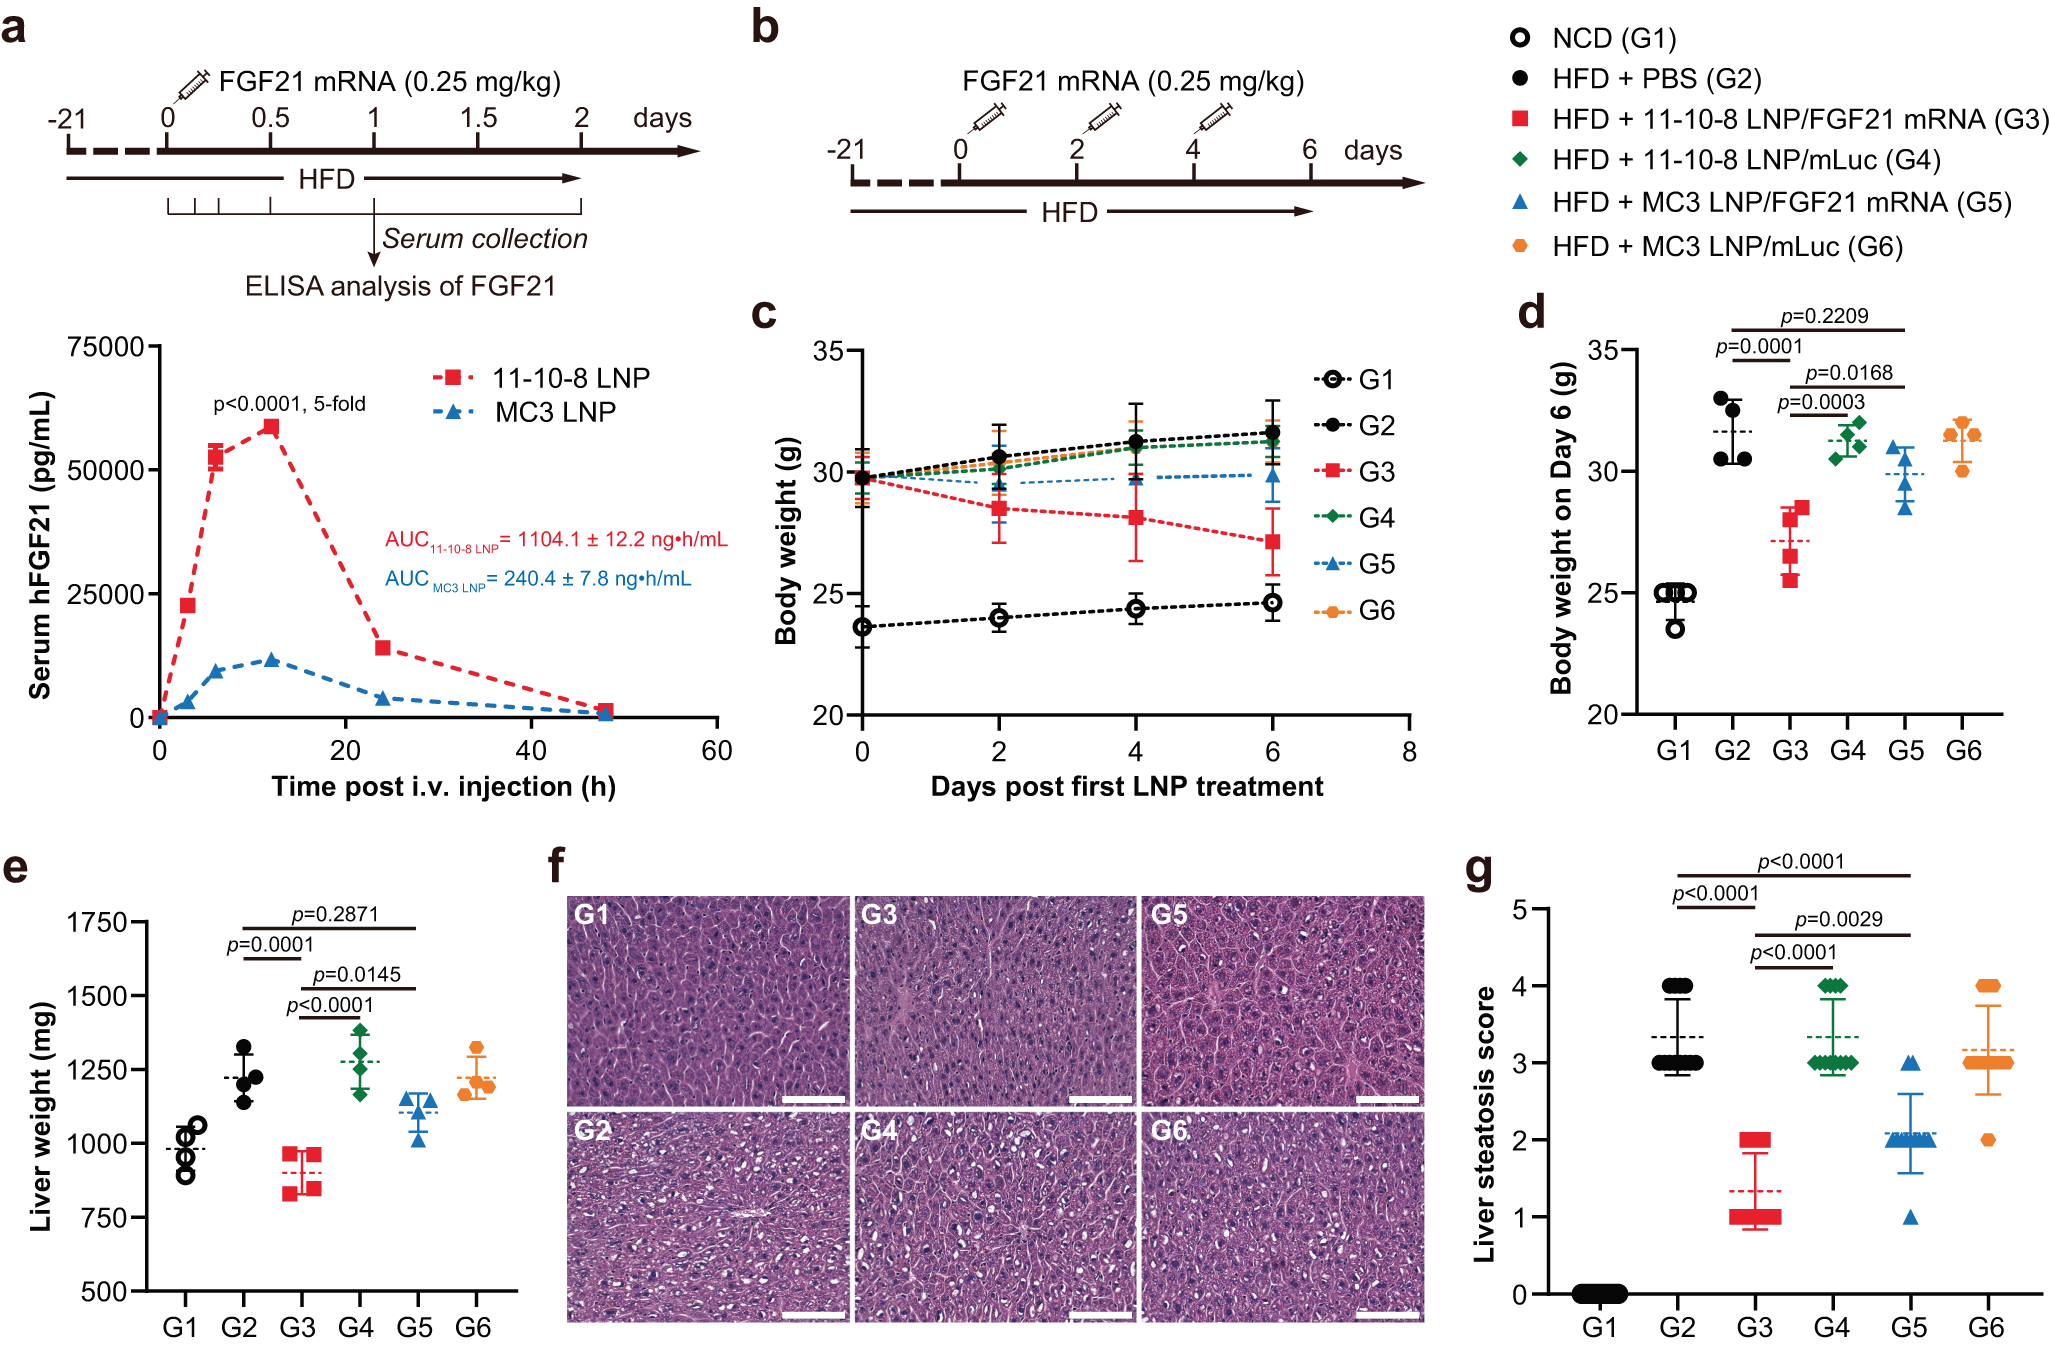
Figure 6 — 11-10-8 delivery of FGF21 mRNA in obese mice
The figure combines FGF21 exposure, body and liver measurements, and liver histology in a high-fat-diet mouse model. Effects depend on both the 11-10-8 formulation and the FGF21 cargo. High-fat-diet male mice; FGF21 mRNA 0.25 mg/kg IV; repeated-dose study shown separately from single-dose exposure; n=4 mice/group; histology scale bar 100 µm.
Han et al. (2024), Nature Communications, Figure 6. CC BY 4.0. Original figure unchanged. Original article / figure · CC BY 4.0. Unmodified complete original figure; displayed at responsive size.