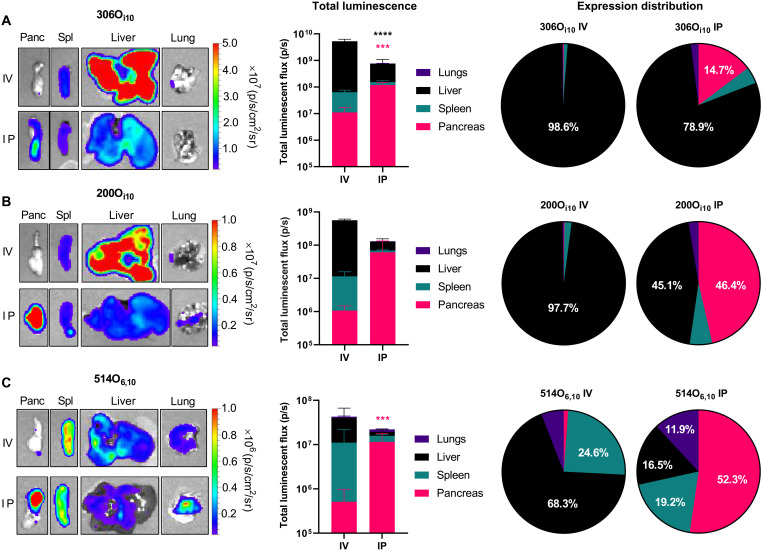
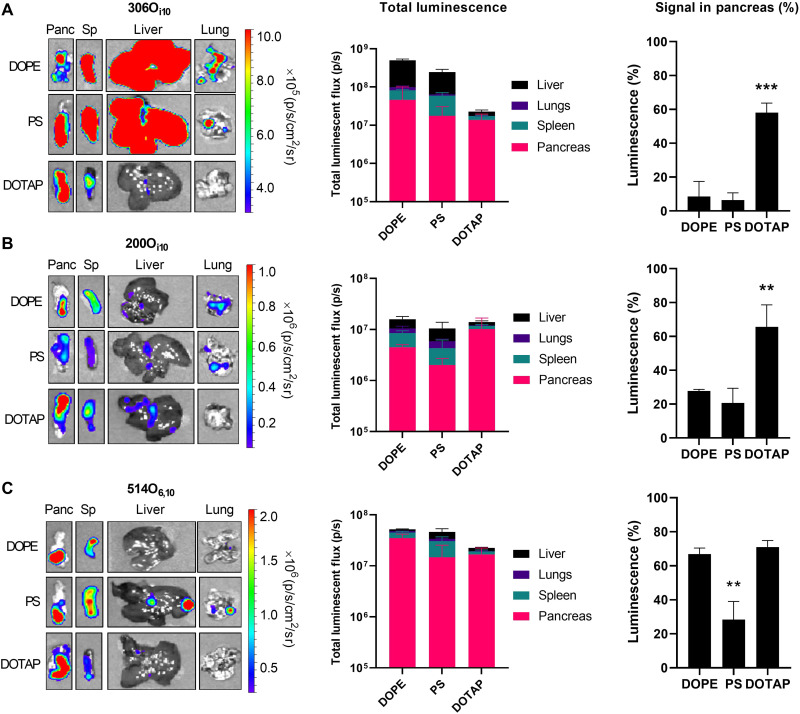
200Oi10-specific results from Figures 1B and 2B, with the complete SI checked to prevent attribution of 306Oi10 results.
The 200Oi10 structure in SI Figure S1 was checked against the catalog connectivity. The catalog molecular weight and formula are retained; paper results are not batch release specifications.
Formulation components and molecular-weight conversion
This table is the IV/IP comparison composition. The separate helper-lipid comparison uses 35:40:22.5:2.5, with DOPE, PS or DOTAP. The source gives a 10:1 lipidoid:mRNA mass ratio. PEG-lipid exact identity/MW is not resolved from the source label, so DMG-PEG2000 is not substituted.
Component mass calculator
Not all inputs are assigned to a single verified study formulation; unassigned fields are blank. Enter your own values to calculate a research scenario. Molecular weights and ratios are editable. Results are calculated, not measured study data. No N/P or RNA dose is inferred.
Component
MW
Molar ratio
Mass (mg)
Mass %
200Oi10
DOPE
Cholesterol
C14-PEG2000 (source label)
Two formulation contexts
Experiment
Lipid:helper:cholesterol:PEG molar ratio
Helper lipid
Source
Route comparison
35:16:46.5:2.5
DOPE
Main Fig. 1B and Methods.
Helper-lipid comparison
35:40:22.5:2.5
DOPE, PS or DOTAP in separate groups
Main Fig. 2B and Methods.
N/P reporting
Methods state 7.8 for DOPE/PS and 8.8 for 40% DOTAP LNPs
These are reported method-level values, not recalculated product specifications.
No 200Oi10-specific N/P calculation is inferred from 10:1 w/w.
Mouse reporter expression: 200Oi10 only
Comparison
Finding
Study context
Intraperitoneal vs intravenous
IP delivery increased pancreatic reporter expression relative to IV in the compared formulations.
Pancreatic signal was broadly similar across helpers, while DOTAP reduced off-target liver/spleen expression.
Same RNA dose and 3 h endpoint; main Fig. 2B.
Overall expression
200Oi10 generated the lowest overall luminescent signal among the lipidoids in the helper comparison.
Main results text. A greater pancreatic fraction is not necessarily a greater absolute pancreatic signal.
Exact pancreatic percentage
Not assigned.
Previously cited secondary figure-derived percentages are not treated as exact primary-source measurements.
What this paper does not establish for 200Oi10
Topic
Evidence boundary
Macrophage-mediated transfer and beta-cell expression
Later experiments followed 306Oi10 with DOTAP; not assigned to 200Oi10.
Disease-model efficacy and tolerability
Later efficacy/safety outcomes belong to the selected follow-up formulation, not automatically all screened lipidoids.
Particle size, PDI, encapsulation and pKa
No target-specific numerical record established for 200Oi10 in the reviewed main/SI.
Original figures
Figures 1 and 2 contain all three lipid groups. For this product, read panel B; other panels are comparators.
Original study figures
Figure 1: Route comparison; 200Oi10 is panel BMelamed et al. (2023), Figure 1. Original, unmodified figure. Panel B is 200Oi10; panels A and C represent other lipidoids. Full caption at source. Original source and caption · CC BY 4.0Figure 2: Helper comparison; 200Oi10 is panel BMelamed et al. (2023), Figure 2. Original, unmodified figure. Panel B is 200Oi10; other lipidoids are shown for study context. Full caption at source. Original source and caption · CC BY 4.0