sales@dcchemicals.com
SM-102 GMP Grade
Formulation & Performance
Formulation & Performance
Study-specific compositions, preparation conditions and experimental outcomes for SM-102.
Complete primary article, six-page Supplementary Figures and reporting summary recovered. This guide covers the matched experimental lipid comparison, short freezing test and 20-week formulated-particle storage study. The study formulations are distinct from marketed vaccine formulations.
1. Formulations and component amounts
Reported composition and calculated mass are separate. Molecular-weight inputs use catalog values or an explicitly identified reference average; DMG-PEG2000 uses 2507. Edit inputs only when using a verified alternative material.
SM-102 — matched experimental mRNA formulation
Molar composition; N/P = 4. The same helper lipids and ratios were used for all three ionizable-lipid comparators. PBS with or without 10% sucrose (w/v) was evaluated as a separate storage/excipient condition.Main Methods: mRNA-LNP production; Fig. 1b; Lipids materials subsection
| Component | Molecular weight | Molar parts | Normalized mol% | Amount (µmol) | Weight (mg) |
|---|---|---|---|---|---|
| SM-102 | 50.000 | 80.2108 | 56.9629 | ||
| DSPC | 10.000 | 16.0422 | 12.6757 | ||
| Cholesterol | 38.500 | 61.7623 | 23.8804 | ||
| 14:0 PEG2000 PE | 1.500 | 2.4063 | 6.4810 |
Calculated total: 100.0000 mg lipid. RNA, solvent and process loss are excluded.
The PEG-lipid calculator input 2693.32 is a reference average for 14:0 PEG2000 PE, not a measurement of the study lot. DMG-PEG2000 is a different material and remains 2507 in catalog calculations.
How component weights are calculated
For total lipid mass M (mg), molar parts rᵢ and molecular weight MWᵢ: component mass = M × rᵢ × MWᵢ / Σ(r × MW). Component amount (µmol) = component mass (mg) × 1000 / MWᵢ. Molar parts are normalized only for the displayed percentage. The calculation does not infer N/P or RNA dose.
2. Preparation and experimental setup
| Parameter | Reported procedure / limitation | Source |
|---|---|---|
| Organic phase | Lipid components dissolved in ethanol at ionizable lipid:DSPC:cholesterol:PEG-lipid 50:10:38.5:1.5 mol%. | Main Methods: mRNA-LNP production |
| Aqueous phase | mRNA at 0.1 mg/mL in 25 mM sodium acetate, pH 5.0. | Main Methods: mRNA-LNP production |
| N/P and mixing | N/P = 4; Y-shaped microfluidic cartridge; total flow 6 mL/min; aqueous:organic flow ratio 3:1. | Main Methods: mRNA-LNP production |
| Purification | Three dialysis exchanges against sterile Ca2+/Mg2+-free PBS using a 3.5 kDa MWCO cassette, followed by concentration through a YM30 centrifugal filter. Duration of each dialysis exchange is not specified. | Main Methods: mRNA-LNP production |
| Final RNA concentration / excipient | 50 µg/mL mRNA, with or without 10% sucrose (w/v); aliquoted for the specified storage conditions. At least two independently prepared batches per LNP type were used. | Main Methods: mRNA-LNP production |
| Particle measurements | DLS at 25 °C; solvent setting water for PBS or 10% sucrose for sucrose-containing samples. RiboGreen used for RNA concentration and encapsulation. | Main Methods: mRNA-LNP characterization |
| Mouse reporter model | 7-week-old female BALB/c mice; 1 µg Fluc mRNA in 20 µL, injected into gastrocnemius muscle; reporter readout 24 h later. | Main Methods: Administration of mRNA-LNP to mice; Bioluminescence imaging |
| Storage design | Aliquoted Fluc mRNA-LNPs at 4 °C or −80 °C; plotted functional tests at weeks 0, 4, 8, 12 and 20. Particle measurements and mouse dosing performed on the same test day. | Fig. 4; Main Methods: mRNA-LNP stability test |
3. Particle characterization
| Measurement / batch | Reported result | Evidence context |
|---|---|---|
| Fresh Fluc-mRNA LNP diameter | 75.5 ± 0.4 nm | Main Results; Fig. 1c. Particle-distribution panels represent two experiments, each using two independent LNP preparations. |
| Encapsulation efficiency | Greater than 95% | Main Results; Fig. 1d; RiboGreen. No precise product-specific mean is invented from the graph. |
| PDI / zeta potential | No numerical values supplied for these batches in the reviewed article/SI | A broader size-distribution curve is not itself a numerical PDI. |
| Apparent pKa cited for the lipid | 6.68 | Fig. 1a and Discussion. Imported from the earlier reference cited by the authors; not a newly measured pKa of this experimental batch. |
| PBS versus 10% sucrose, short 4 °C condition | 74.4 ± 5.1 nm versus 89.7 ± 5.6 nm | Main Results; Fig. 3b |
| Sucrose concentration effect | Size increase observed between 2% and 10% sucrose; no additional increase reported above 10% | Supplementary Fig. 2. Separate from the fresh Fig. 1 measurement batch. |
4. Performance by experiment
| Experiment and dose | Readout and comparator | Result and source |
|---|---|---|
| Matched intramuscular reporter comparison SM-102 LNP versus the other lipid formulations; 1 µg Fluc mRNA in 20 µL IM; female BALB/c mice; n=6/group | Readout: 24 h; total photon emission in the injection-site region Comparator: ALC-0315 and cKK-E12 | SM-102 produced approximately 60% higher mean reporter signal than ALC-0315/cKK-E12 under the matched conditions; Fig. 1f marks p<0.05 comparisons.Fig. 1e–f; mean ± SEM; one-way ANOVA with Tukey comparisons |
| Neutralizing-antibody response Spike-antigen mRNA; 1 µg IM per dose on days 1 and 21; n=10/group | Readout: Plasma collected days 14 and 35; pseudovirus-neutralization endpoint Comparator: Other ionizable-lipid comparators at the same helper-lipid composition | SM-102 elicited a modest but statistically higher neutralization response than ALC-0315 at both sampling points. All groups increased titers more than 28-fold after boosting.Fig. 2c–f; median Neut50 displayed in violin plots; n=10; no exact Neut50 values extracted |
| Inflammatory markers after prime and boost Same IM antigen-mRNA study, 1 µg per dose; n=10/group | Readout: Day 2 and day 22, each 24 h after dosing Comparator: Pre-immune plasma and cKK-E12 LNP | No significant increase was generally detected for the measured inflammatory panel with SM-102 or ALC-0315 relative to pre-immune plasma. cKK-E12 produced stronger responses for several markers. This is a limited time-point panel, not comprehensive toxicology.Fig. 2b; Supplementary Fig. 1; mean ± SEM |
| Sucrose and short freezing exposure SM-102 Fluc mRNA-LNP, PBS ±10% sucrose; held 1 h at 4 °C or frozen at −80 °C then thawed | Readout: DLS after storage / thawing Comparator: Same LNP without sucrose | Sucrose prevented the broad/multiple particle-size peaks observed after freezing and thawing without sucrose. The experiment does not test 20 repeated freeze–thaw cycles.Fig. 3a–b; Supplementary Fig. 2 |
| Functional delivery after short storage 1 µg Fluc mRNA in 20 µL IM after the Fig. 3 storage conditions; n=5/group | Readout: 24 h after injection Comparator: PBS without sucrose and frozen samples with/without sucrose | For refrigerated samples, 10% sucrose increased reporter expression by approximately 30–40%; sucrose preserved functional delivery through the tested freezing–thawing exposure.Fig. 3c–f; mean ± SEM; two-way ANOVA with Sidak comparisons |
| Long-term formulated-particle storage SM-102 Fluc mRNA-LNP at 50 µg/mL; 10% sucrose; 4 °C versus −80 °C; 1 µg IM test dose; n=5/group per functional readout | Readout: Weeks 0, 4, 8, 12 and 20; mouse imaging 24 h after each test injection Comparator: Week-0 activity and the other ionizable-lipid formulation | SM-102 retained activity better than ALC-0315 at 4 °C, but both developed aggregation around week 8 and lost functional activity with prolonged refrigeration. Activity was retained at −80 °C across the tested period.Fig. 4a–d; mean ± SEM; within-group comparisons to week 0 |
| Encapsulation versus functional stability Same storage study; formulated Fluc mRNA-LNP | Readout: Particle/encapsulation monitoring; RNA gel at week 20 Comparator: 4 °C versus −80 °C | Encapsulation remained high while refrigerated functional potency declined. Gel analysis showed comparable detectable RNA after 20 weeks at both temperatures; retained encapsulation or RNA band intensity did not guarantee retained delivery activity.Fig. 4b,e; gel representative of two independent LNP preparations |
Mechanistic evidence
The authors discuss ionization and endosomal escape as possible contributors to the matched delivery difference. They did not directly measure comparative endosomal-escape rates here. Aggregation correlated with loss of refrigerated reporter potency, while RNA remained detectable; the study does not prove one exclusive molecular cause of instability.
5. Interpretation and unresolved details
- These are controlled experimental LNPs with identical helper lipids, not replicas of the marketed vaccines. Their relative reporter potency and storage results cannot be transferred directly to clinical vaccine efficacy or approved shelf life.
- The Methods identify 14:0 PEG2000 PE (dimyristoyl PE, material 880150P). The Fig. 1 caption instead expands PEG2000 PE as dioleoyl; the formulation table follows the explicit Methods identity and flags this source inconsistency.
- DMG-PEG2000 and ALC-0159 are not the PEG lipid used in this matched experiment. The universal catalog DMG-PEG2000 molecular weight remains 2507, but it must not replace the molecular weight of a chemically different PEG lipid.
- The cited pKa values are prior-literature reference values. No batch-specific pKa, numerical PDI or zeta potential is supplied in this study.
- Storage findings concern RNA-loaded LNPs, not neat lipid, empty LNP kits or lyophilized material. The one-cycle short freezing experiment does not demonstrate repeated freeze–thaw resistance.
- The separate UTR and wobble-nucleoside experiments used cKK-E12. They are not assigned as SM-102- or ALC-0315-specific results.
Results apply to the stated LNP composition, cargo, process, dose, route and model. LNP experimental measurements are not batch-release specifications for the isolated lipid.
6. References and data access
Zhang L, More KR, Ojha A, et al. Effect of mRNA-LNP components of two globally-marketed COVID-19 vaccines on efficacy and stability. npj Vaccines 8, 156 (2023).
DOI: 10.1038/s41541-023-00751-6
PEG-lipid identity and molecular-weight reference
Download experiment table (CSV) · Open printable Formulation & Performance guide
Revision FP-20261024-b3 · Source review: 24 October 2026 · DC Chemicals
Published study figures
Original publication figures illustrating the cited formulation and biological results. Select an image to view it at full size.
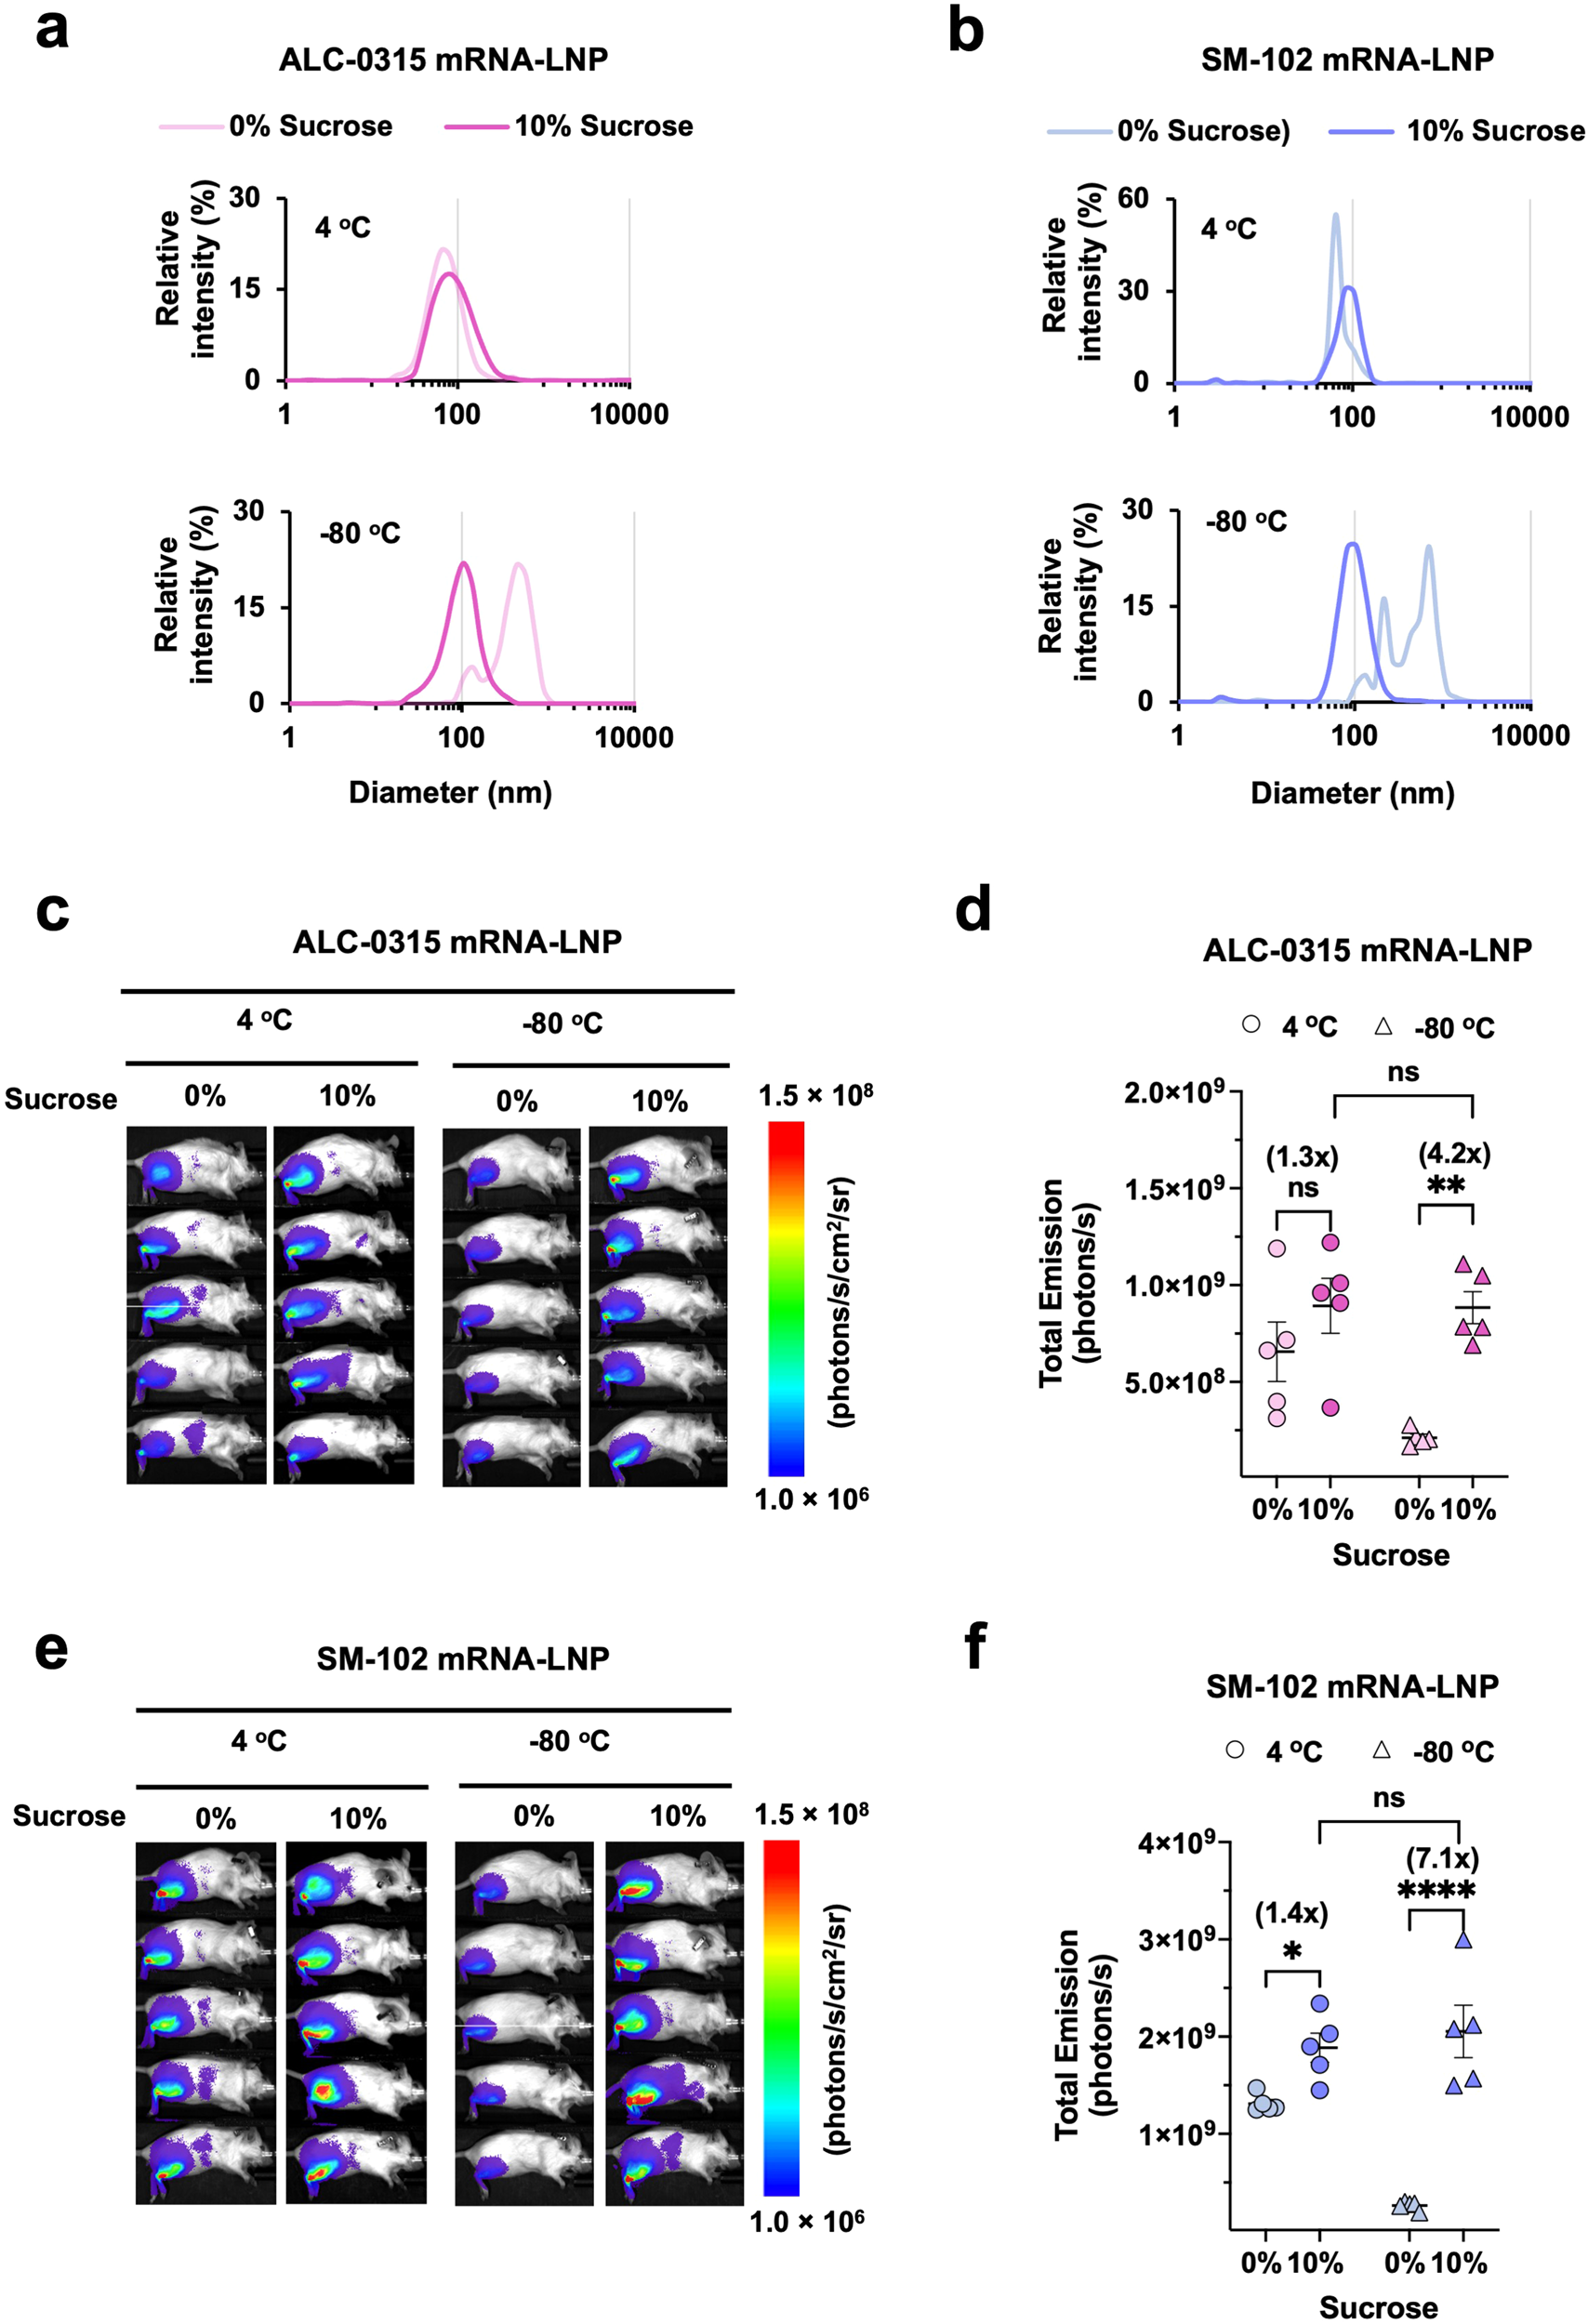
Figure 3 — Sucrose, particle size and reporter expression
The original panels compare ALC-0315 and SM-102 formulations with or without sucrose. Particle-size profiles and mouse imaging show that formulation and storage conditions influence subsequent expression. LNPs held for 1 hour at 4°C or −80°C, with or without 10% sucrose; 1 µg FLuc mRNA IM; imaging at 24 hours; n=5 mice/group.
Zhang et al. (2023), npj Vaccines, Figure 3. CC BY 4.0. Original figure unchanged. Original article / figure · CC BY 4.0. Unmodified complete original figure; displayed at responsive size.
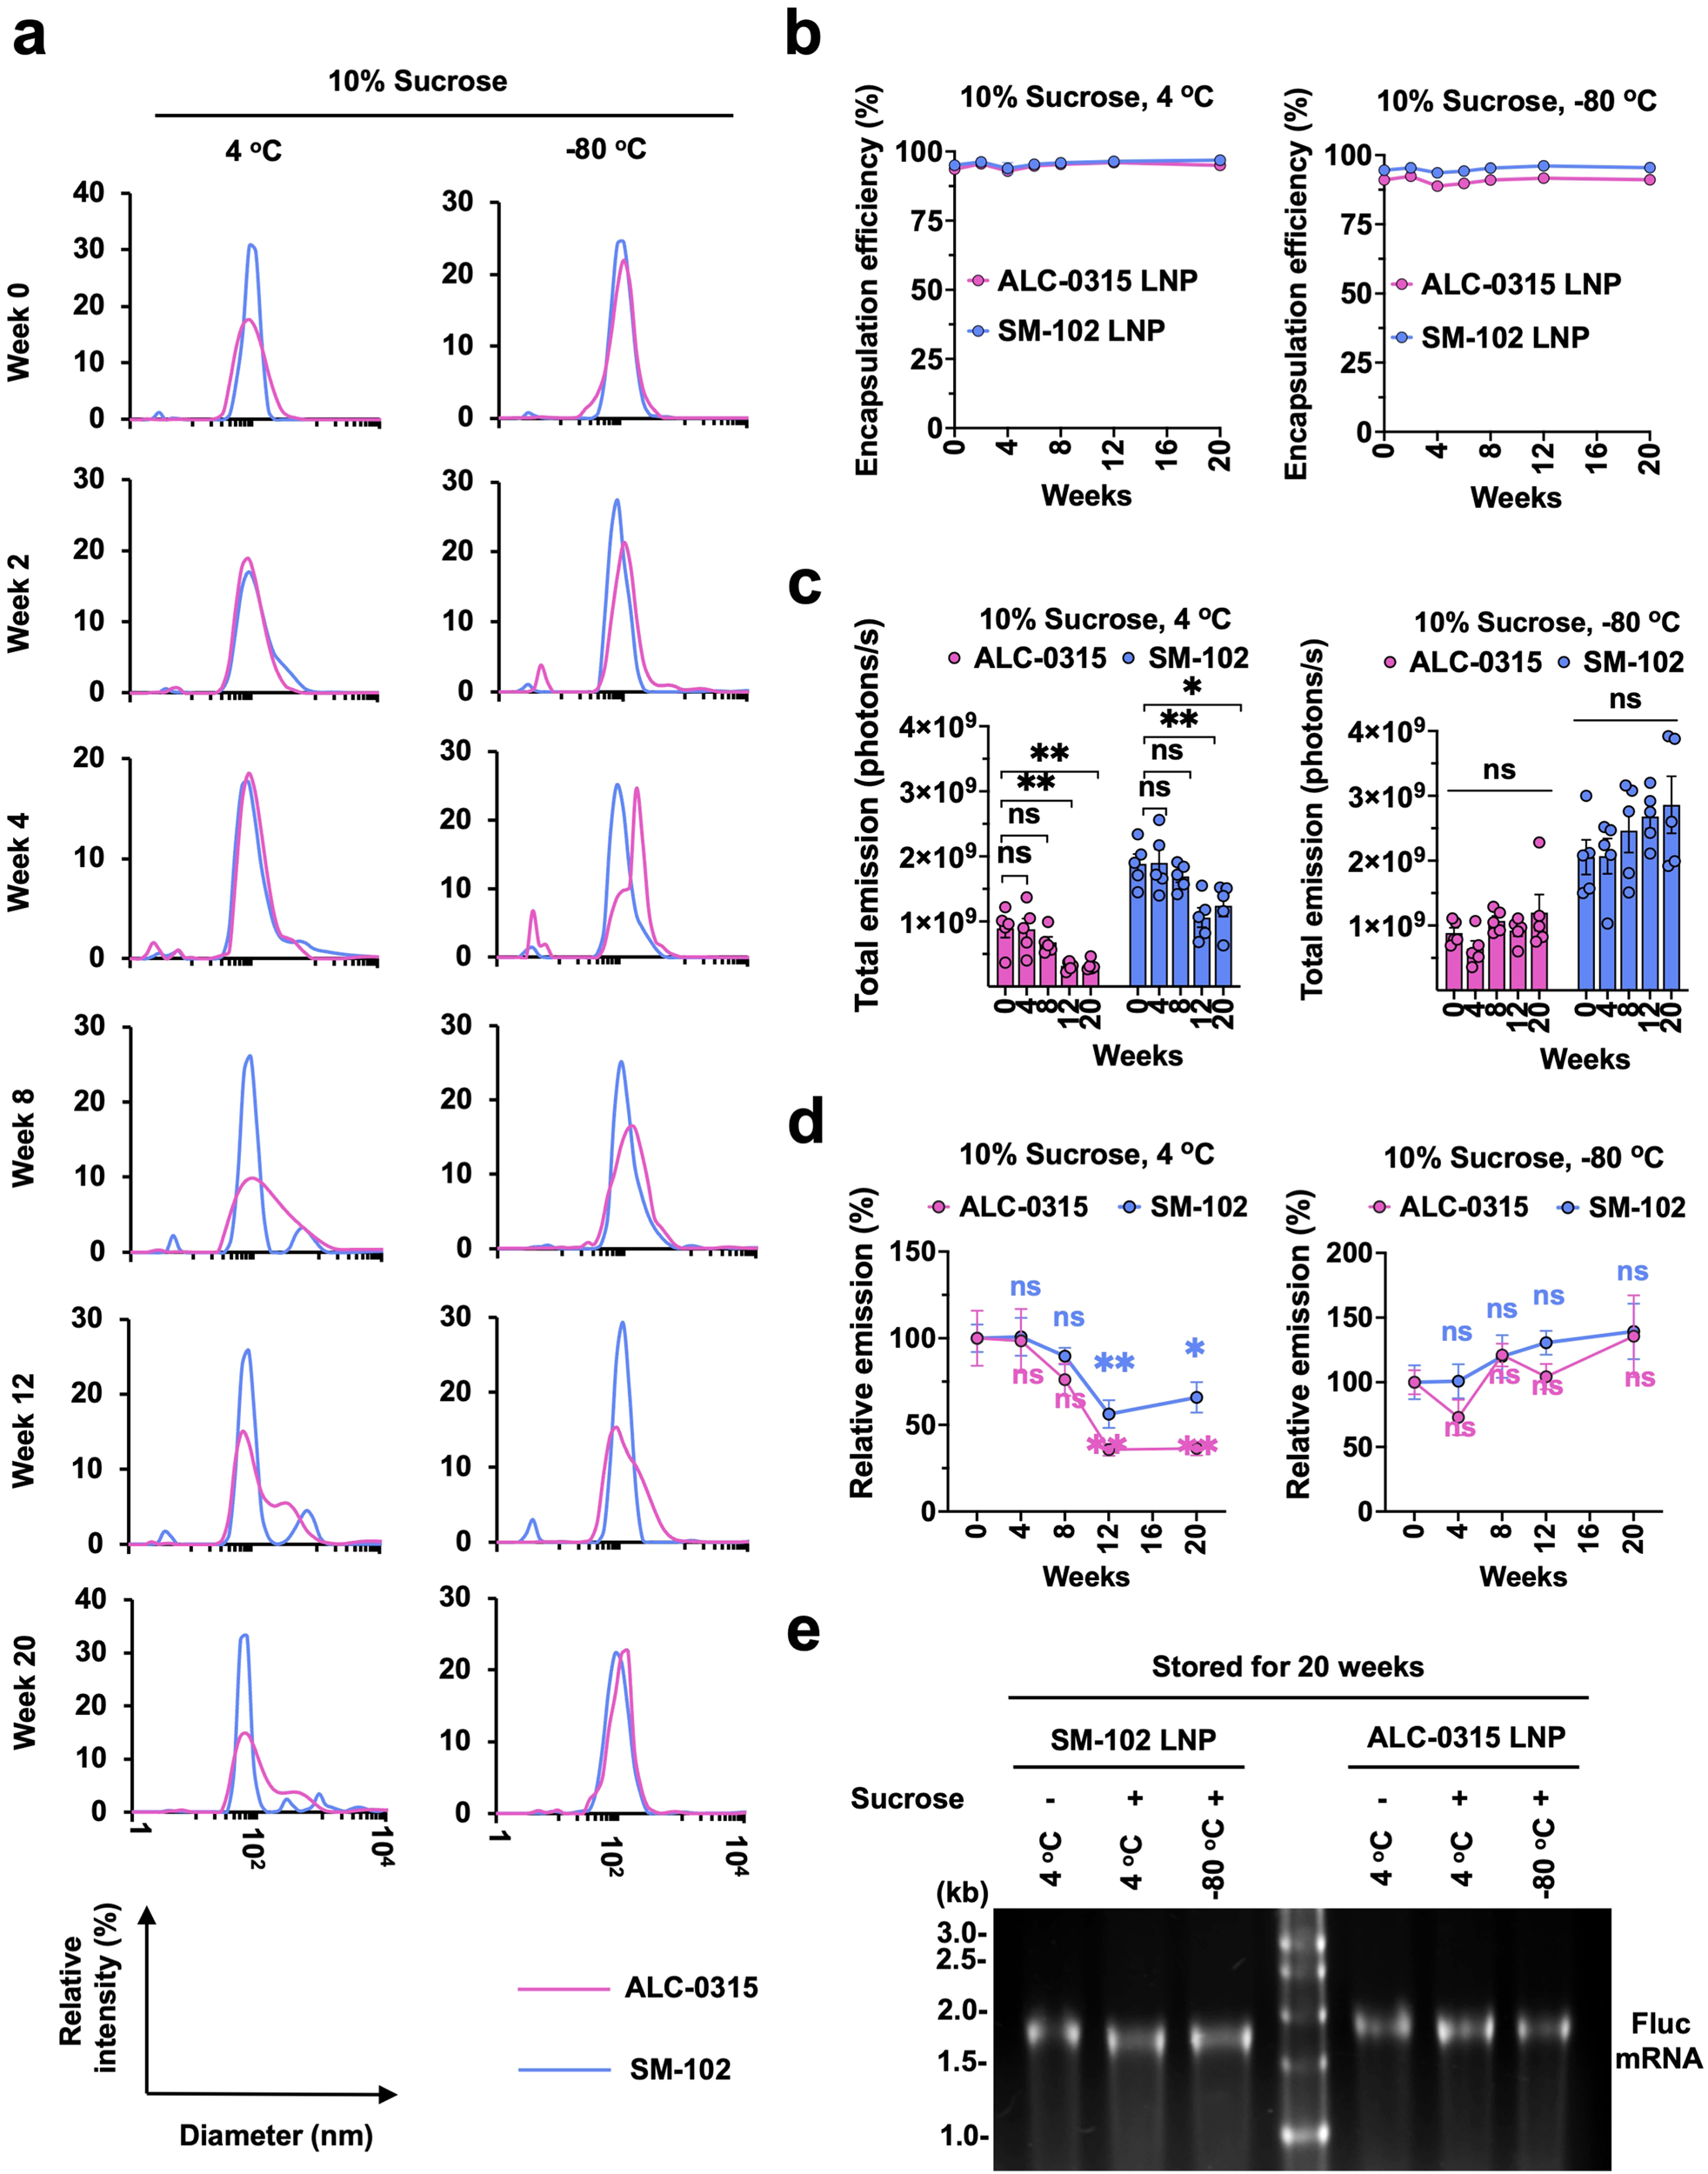
Figure 4 — Long-term LNP storage and retained expression
ALC-0315 and SM-102 formulations are compared through particle size, RNA encapsulation, mouse expression and RNA integrity. These are formulated-LNP stability results, not the shelf life of neat lipid. Storage at 4°C or −80°C; reporter expression measured 24 hours after injection of stored formulations; mean ± SEM, n=5 mice/group.
Zhang et al. (2023), npj Vaccines, Figure 4. CC BY 4.0. Original figure unchanged. Original article / figure · CC BY 4.0. Unmodified complete original figure; displayed at responsive size.