sales@dcchemicals.com
DLin-MC3-DMA
Formulation & Performance
Formulation & Performance
Study-specific compositions, preparation conditions and experimental outcomes for DLin-MC3-DMA.
Complete article and 126-page Supporting Information recovered. Lipid 16 identity, preparation, mouse FVII and cynomolgus-monkey TTR experiments were checked separately. The optimized PEG chemical identity and a conflicting loading-ratio statement remain unresolved.
1. Formulations and component amounts
Reported composition and calculated mass are separate. Molecular-weight inputs use catalog values or an explicitly identified reference average; DMG-PEG2000 uses 2507. Edit inputs only when using a verified alternative material.
Initial preformed-vesicle screening composition
Molar composition. The article identifies a C18 ether-linked PEG carbamate; it is not assumed to be catalog DMG-PEG2000.Main formulation paragraph; SI PDF pp. 39–40
| Component | Molecular weight | Reported molar entry | Calculated mass |
|---|---|---|---|
| DLin-MC3-DMA | 642.11 | 40 | Not calculated |
| DSPC | 790.15 | 10 | Not calculated |
| Cholesterol | 386.65 | 40 | Not calculated |
| C18 dialkyl-ether PEG2000 carbamate | Not confirmed | 10 | Not calculated |
No complete mass recipe is generated for this formulation while composition or identity-dependent inputs remain unresolved.
Optimized composition for mouse / non-human-primate studies
Molar composition. The optimized method says PEG-lipid without a resolved product-specific chemical identity; complete mass calculation is withheld rather than substituting a different PEG material.Main Fig. 7; SI PDF pp. 42–43
| Component | Molecular weight | Reported molar entry | Calculated mass |
|---|---|---|---|
| DLin-MC3-DMA | 642.11 | 50 | Not calculated |
| DSPC | 790.15 | 10 | Not calculated |
| Cholesterol | 386.65 | 38.5 | Not calculated |
| PEG-lipid (optimized identity not independently resolved) | Not confirmed | 1.5 | Not calculated |
No complete mass recipe is generated for this formulation while composition or identity-dependent inputs remain unresolved.
MC3 average molecular weight is 642.11. DMG-PEG2000 uses 2507 wherever it is the confirmed component; that value is not assigned to an unresolved or chemically different PEG-lipid.
How component weights are calculated
For total lipid mass M (mg), molar parts rᵢ and molecular weight MWᵢ: component mass = M × rᵢ × MWᵢ / Σ(r × MW). Component amount (µmol) = component mass (mg) × 1000 / MWᵢ. Molar parts are normalized only for the displayed percentage. The calculation does not infer N/P or RNA dose.
2. Preparation and experimental setup
| Parameter | Reported procedure / limitation | Source |
|---|---|---|
| Screening lipid phase | MC3/DSPC/cholesterol/PEG-lipid 40:10:40:10 in ethanol; introduce into 50 mM citrate, pH 4, to final ethanol 30% v/v and lipid 6.1 mg/mL. | SI PDF pp. 39–40 |
| Preformed vesicles | Equilibrate 2 min at room temperature; extrude through two stacked 80 nm filters at 22 °C, generally 1–3 passes, to the stated 70–90 nm screening size range. | SI PDF p. 40 |
| siRNA loading | siRNA in 50 mM citrate pH 4 with 30% ethanol; add at approximately 5 mL/min to vesicles pre-equilibrated at 35 °C; incubate a further 30 min at 35 °C. | SI PDF p. 40 |
| Screening loading-ratio discrepancy | Main article: siRNA:total lipid approximately 0.05 w/w; SI preparation target: 0.06 w/w. Their reciprocals are approximately 20:1 and 16.7:1 total lipid:siRNA. These are source-specific mass statements, not N/P. | Main formulation paragraph; SI PDF p. 40 |
| Buffer exchange | Dialysis into PBS containing 155 mM NaCl, 3 mM Na2HPO4 and 1 mM KH2PO4, pH 7.5. Dialysis duration is not stated in the recovered method. | SI PDF p. 40 |
| Optimized monkey preparation | Spontaneous-formation procedure cross-referenced to earlier papers; 50:10:38.5:1.5 composition. SI prints siRNA-to-lipid 0.9 w/w; this unresolved value is not silently changed to 0.09 or converted into a recommended preparation ratio. | SI PDF p. 42, visually checked |
| Mouse assay | Female C57BL/6 mice, 8–10 weeks; lateral-tail-vein injection in 10 mL/kg; serum collected at 24 h. FVII activity measured colorimetrically at 405 nm relative to saline control. | SI PDF p. 40 |
| Monkey assay | Cynomolgus monkeys, n=3 per dose; siTTR 0.03, 0.1 or 0.3 mg/kg; 15-min cephalic-vein infusion, 5 mL/kg; liver sampled at 48 h. TTR mRNA normalized to GAPDH using branched-DNA assay. | SI PDF pp. 42–43 |
3. Particle characterization
| Measurement / batch | Reported result | Evidence context |
|---|---|---|
| Apparent LNP pKa | 6.44; duplicate titrations | SI Fig. S1, PDF p. 41. This is an in situ particle titration, not a universal neat-molecule constant. |
| TNS method | 100 µM lipid and 1 µM TNS; excitation 321 nm, emission 445 nm; half-maximal fitted fluorescence | SI PDF p. 41: HEPES/MES/ammonium acetate 10 mM each, NaCl 130 mM, pH 2.5–11. Main text describes pH 3–10; method versions remain distinguished. |
| Size and dispersity boundary | 70–90 nm and PDI 0.11 ± 0.04 summarize the 56-lipid screening library | Main text, n=56. Not an individually tabulated MC3 size/PDI or a specification for the optimized formulation. |
| Product-specific EE / zeta potential | No separately quantified MC3 value recovered for these formulations | Not filled from library averages or other papers. |
| Product identity | Lipid 16; C43H79NO2; molecular weight 642.11 | Main Fig. 4; supporting information |
4. Performance by experiment
| Experiment and dose | Readout and comparator | Result and source |
|---|---|---|
| Initial mouse FVII potency MC3 lipid 16 in the 40:10:40:10 composition; FVII siRNA IV; female C57BL/6 mice; four-dose screen, n=4 per dose | Readout: 24 h; serum FVII activity Comparator: Saline and other screened lipids | Reported ED50 0.03 mg siRNA/kg. Do not attach the later 0.005 mg/kg value to this screening recipe.Main Table 1 and Figs. 3–5; SI PDF p. 40 |
| Optimized mouse FVII potency 50:10:38.5:1.5 composition; FVII siRNA IV; n=5 per dose | Readout: 24 h according to the FVII assay method Comparator: Saline; earlier screening composition | Reported ED50 approximately 0.005 mg/kg, a sixfold lower dose than the 0.03 mg/kg screening value. Mean ± SD plotted; full optimized PEG / loading inputs remain unresolved.Main Fig. 7 inset; SI PDF p. 40 |
| Cynomolgus-monkey TTR silencing Optimized MC3-LNP; siTTR 0.03, 0.1 or 0.3 mg/kg; 15-min IV infusion; n=3/group | Readout: 48 h; liver TTR mRNA relative to GAPDH Comparator: Control-normalized hepatic TTR expression | Reported ED50 <0.03 mg/kg. This is hepatic mRNA reduction, not serum TTR protein reduction or a clinical endpoint.Main Fig. 7; SI PDF pp. 42–43 |
| Mixed-lipid pKa / potency comparison FVII siRNA 0.1 mg/kg IV; mixed lipids 15/16/17 occupy the 40 mol% ionizable fraction; n=4 | Readout: 24 h; serum FVII activity Comparator: Pure lipid 16 (MC3) and pure lipids 15 or 17 | An equimolar mixture of lipids 15 and 17 achieved pKa and activity similar to MC3; no tested mixture exceeded MC3 alone. These mixtures are separate materials, not a new pure-MC3 recipe.Main Fig. 6; SI Fig. S2 |
| In situ pKa determination 40:10:40:10 MC3 preformed vesicles; fluorescence titration in duplicate | Readout: Room-temperature TNS fluorescence Comparator: pH titration baseline and fitted maximum | Mean apparent pKa 6.44. The library activity optimum near pKa 6.2–6.5 is specific to the studied hepatic siRNA system.SI Fig. S1; main Figs. 3–5 |
Mechanistic evidence
Within this related hepatic-siRNA lipid series, intermediate ionization at physiological and endosomal pH correlates with activity. Lipid-mixing experiments support a role for particle pKa, while the paper explicitly cautions that the trend may not apply to other ApoE-independent delivery systems. This is not a universal best-lipid or best-pKa claim.
5. Interpretation and unresolved details
- Keep the initial and optimized formulations separate: 0.03 and approximately 0.005 mg/kg are different mouse ED50 results.
- The monkey endpoint is liver TTR mRNA at 48 h; the mouse endpoint is serum FVII activity at 24 h.
- The initial PEG component is explicitly C18 ether-linked carbamate. The optimized PEG identity is not independently resolved here; no DMG-PEG2000 substitution is asserted.
- The main/SI screening mass ratios differ (0.05 versus 0.06 siRNA:lipid); the optimized monkey SI prints 0.9 w/w. These inconsistencies prevent issuing one definitive loading recipe.
- Clinical chemistry and hematology were collected pre-dose and at 48 h in monkeys, but no numeric safety outcomes were recovered in this paper. Do not infer general safety from efficacy.
- Average molecular weight 642.11 replaces the prior 641.61 value, which matches neutral monoisotopic mass. Formula and structure are unchanged.
Results apply to the stated LNP composition, cargo, process, dose, route and model. LNP experimental measurements are not batch-release specifications for the isolated lipid.
6. References and data access
Jayaraman M, Ansell SM, Mui BL, et al. Maximizing the Potency of siRNA Lipid Nanoparticles for Hepatic Gene Silencing In Vivo. Angewandte Chemie International Edition. 2012;51:8529–8533.
Download experiment table (CSV) · Open printable Formulation & Performance guide
Revision FP-20261024-b3 · Source review: 24 October 2026 · DC Chemicals
Published study figures
Original publication figures illustrating the cited formulation and biological results. Select an image to view it at full size.
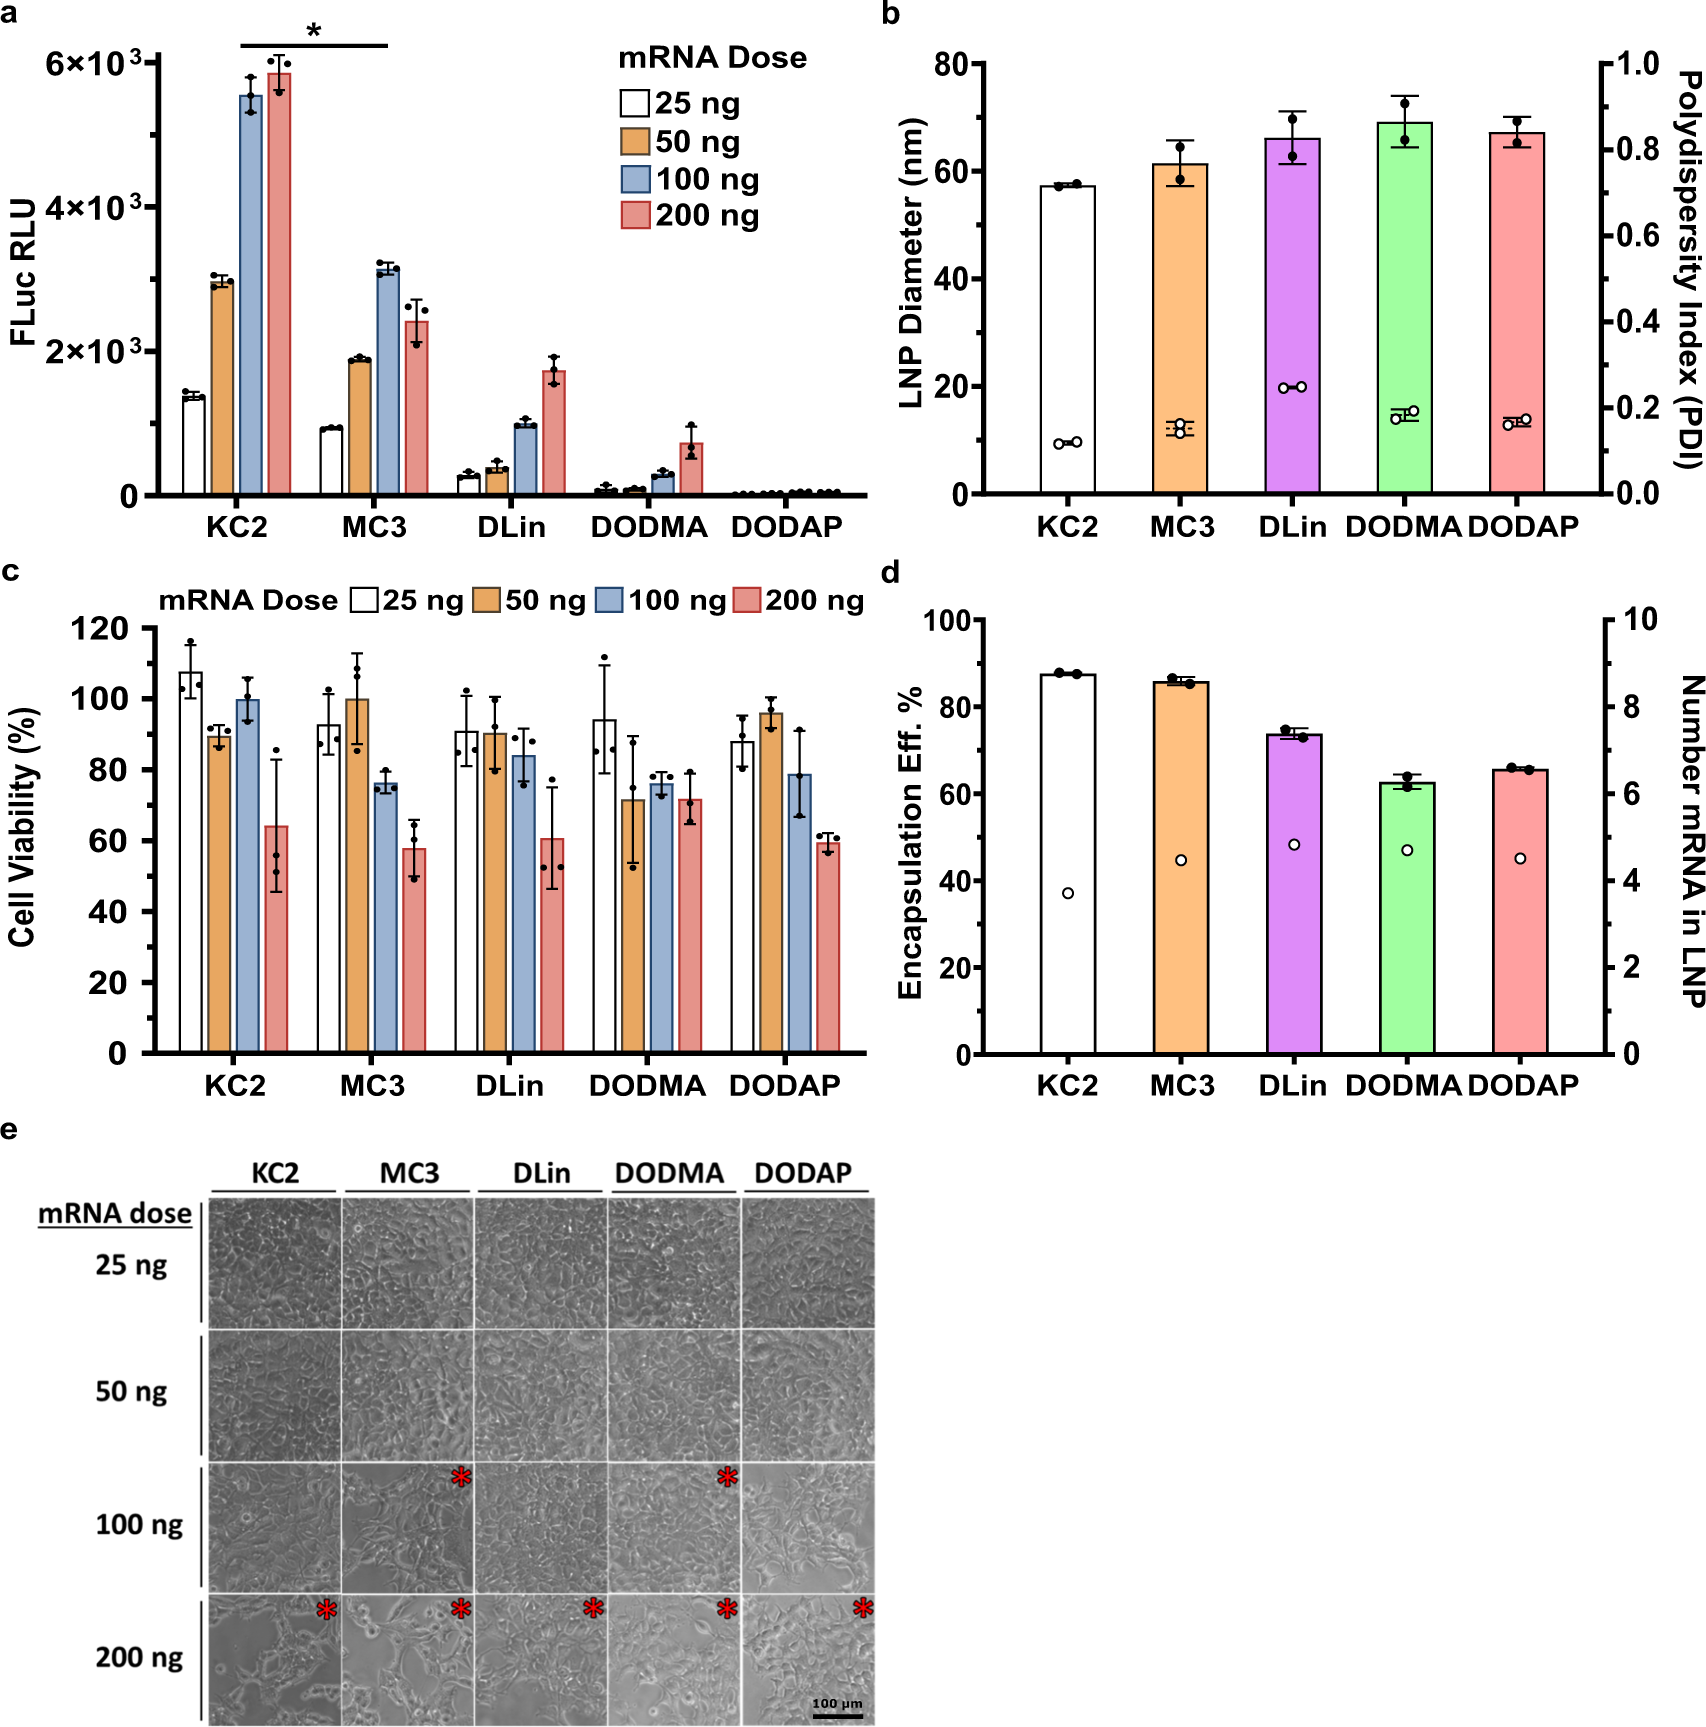
Figure 3 — Cell expression, viability and LNP characteristics
DLinDMA (labelled DLin) is compared with KC2, MC3, DODMA and DODAP. Luciferase expression and cell viability are shown across mRNA doses; the particle-size and encapsulation measurements refer to the same study formulations. HEK293 cells; FLuc mRNA; N/P 4; 25–200 ng mRNA; 24-hour cell assessment; mean ± SD, n=3.
Carrasco et al. (2021), Communications Biology, Figure 3. CC BY 4.0. Original figure unchanged. Original article / figure · CC BY 4.0. Unmodified complete original figure; displayed at responsive size.
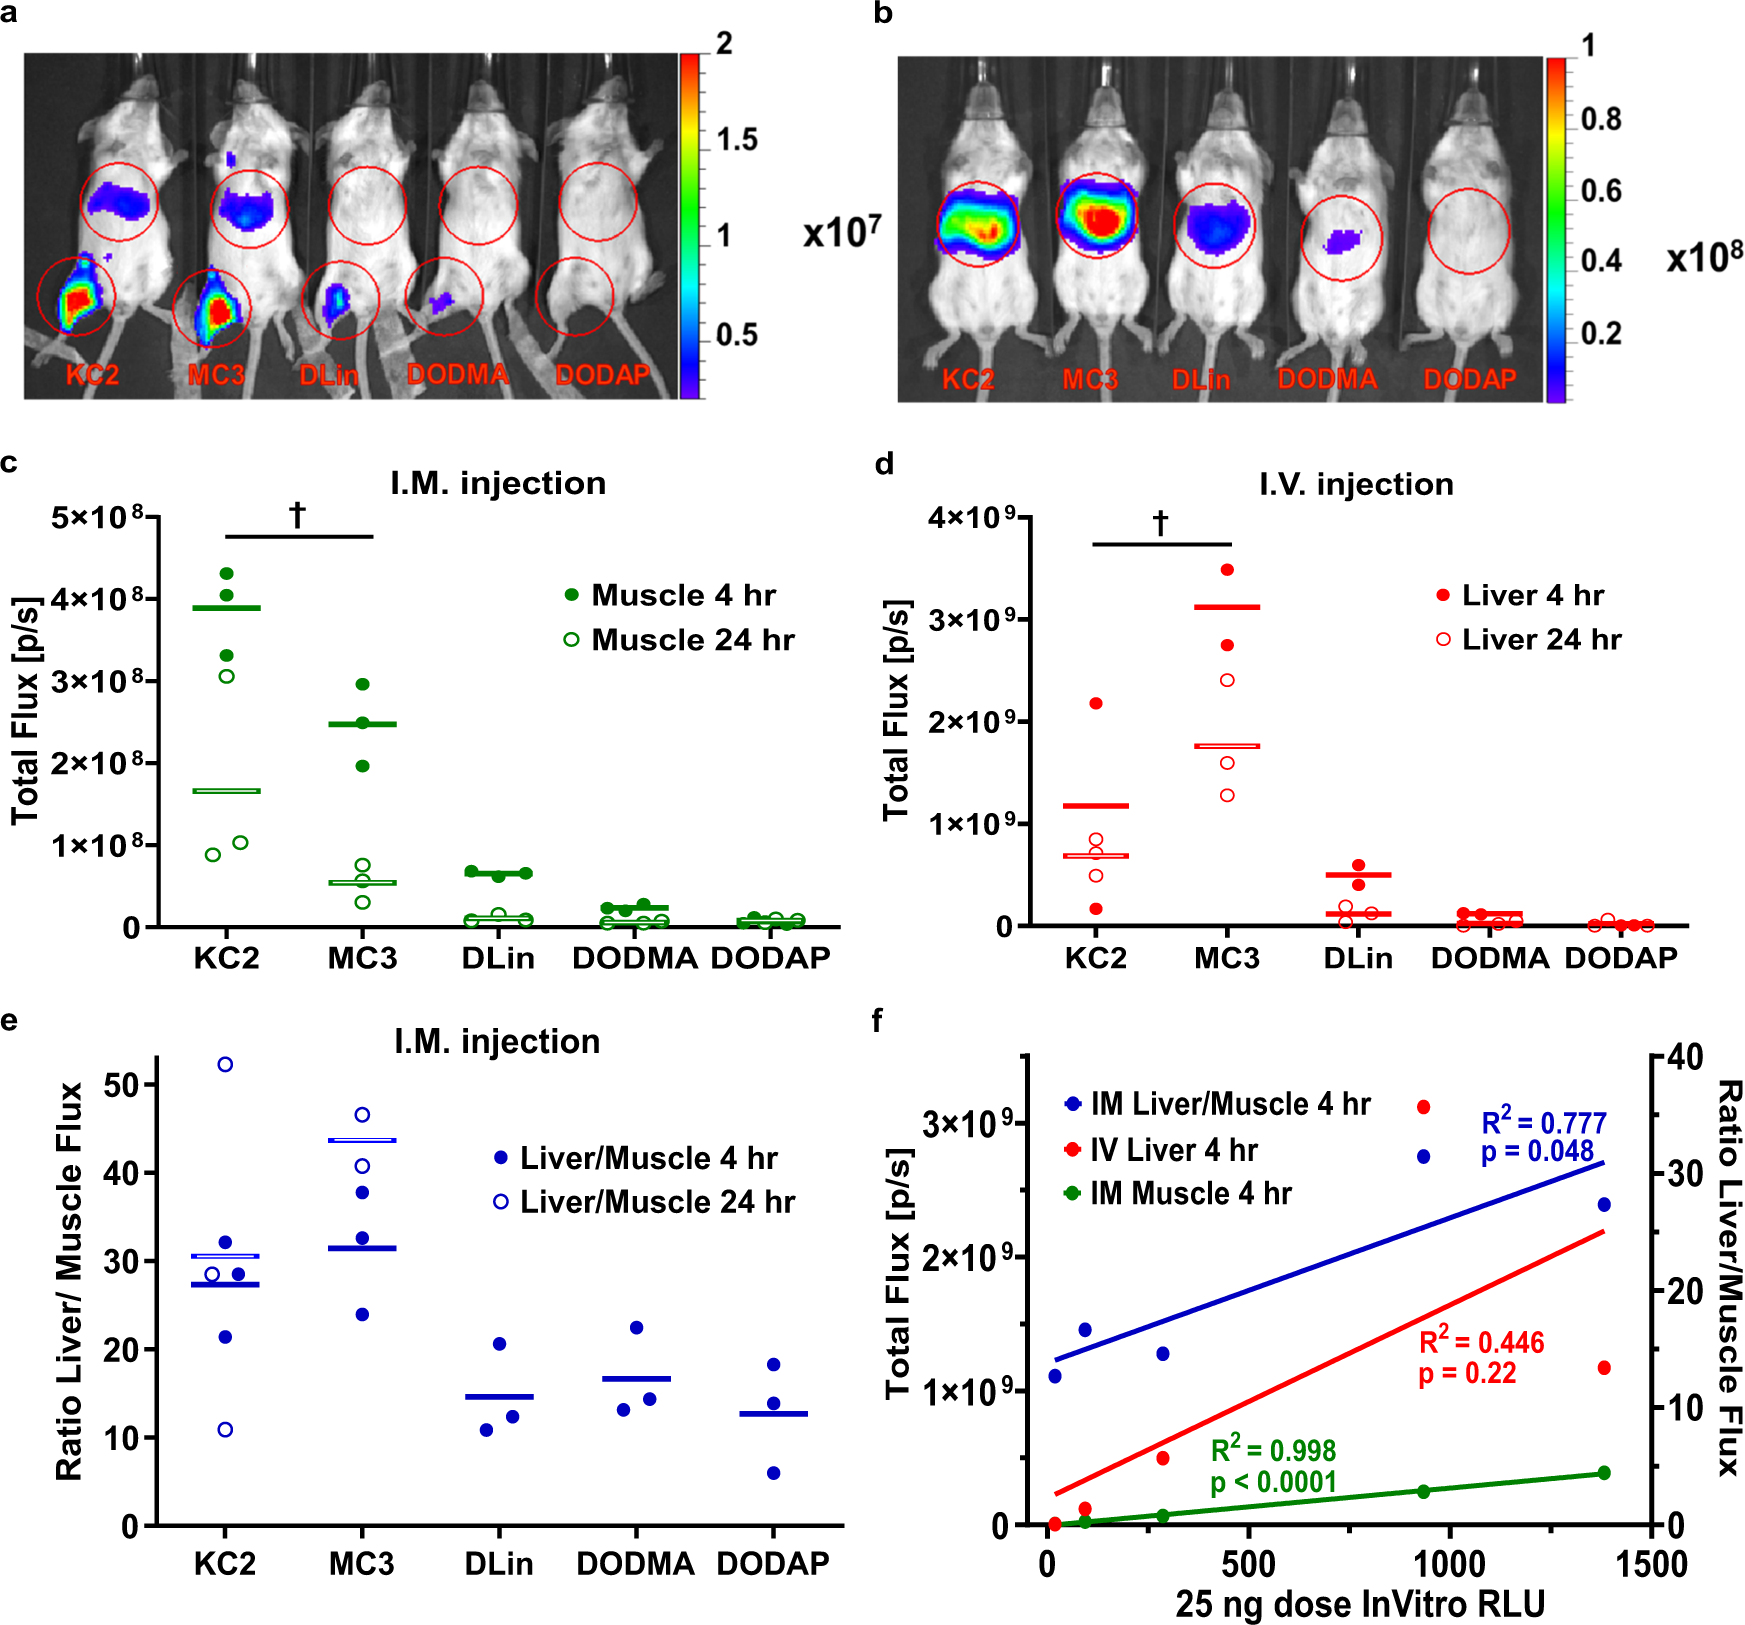
Figure 4 — Route-dependent reporter expression in mice
DLinDMA (DLin), MC3, DODMA and DODAP are individually labelled alongside KC2. The relative performance changes between intramuscular and intravenous administration; results should be read within the route and time point shown. 5 µg FLuc mRNA per mouse; N/P 4; IM or IV; measurements at 4 and 24 hours.
Carrasco et al. (2021), Communications Biology, Figure 4. CC BY 4.0. Original figure unchanged. Original article / figure · CC BY 4.0. Unmodified complete original figure; displayed at responsive size.