DCL0022 · Research use only
FS01 · Formulation & Performance
FS01 · DCL0022 · Literature evidence
Intra-articular mRNA delivery and arthritis research
FS01 was selected for this local-delivery application. The study does not establish a universally best ionizable lipid.
Formulation and component weights
| Component | Catalog | Molecular weight | Molar proportion | Mass % |
|---|---|---|---|---|
| FS01 | DCL0022 | 866.33 | 50% | 62.00% |
| DSPC | DC57005 | 790.15 | 10% | 11.31% |
| Cholesterol | DCD-041 | 386.65 | 38.5% | 21.31% |
| DMG-PEG2000 | DC40169 | 2507 | 1.5% | 5.38% |
Source discrepancy: the Results paragraph reverses the names DSPC and cholesterol. This table follows the Materials and Methods assignment (FS01:DSPC:cholesterol:DMG-PEG2000 = 50:10:38.5:1.5), also supported by patent paragraph 0121. Confirm the intended composition against the final publication before experimental use.
| Parameter | Reported information |
|---|---|
| N/P ratio | Not reported in the supplied main paper. |
| Therapeutic cargo | IL-1Ra mRNA; ANL3 mRNA; or their combination at a 1:1 mRNA mass ratio. |
| Mixing description | The Methods report microfluidic mixing and an organic:aqueous volume ratio of 3:1. The phase orientation requires confirmation; it has not been silently reversed. |
| Formulation context | The same lipid component ratio is described for the four-lipid screen and the FS01 therapeutic formulations. |
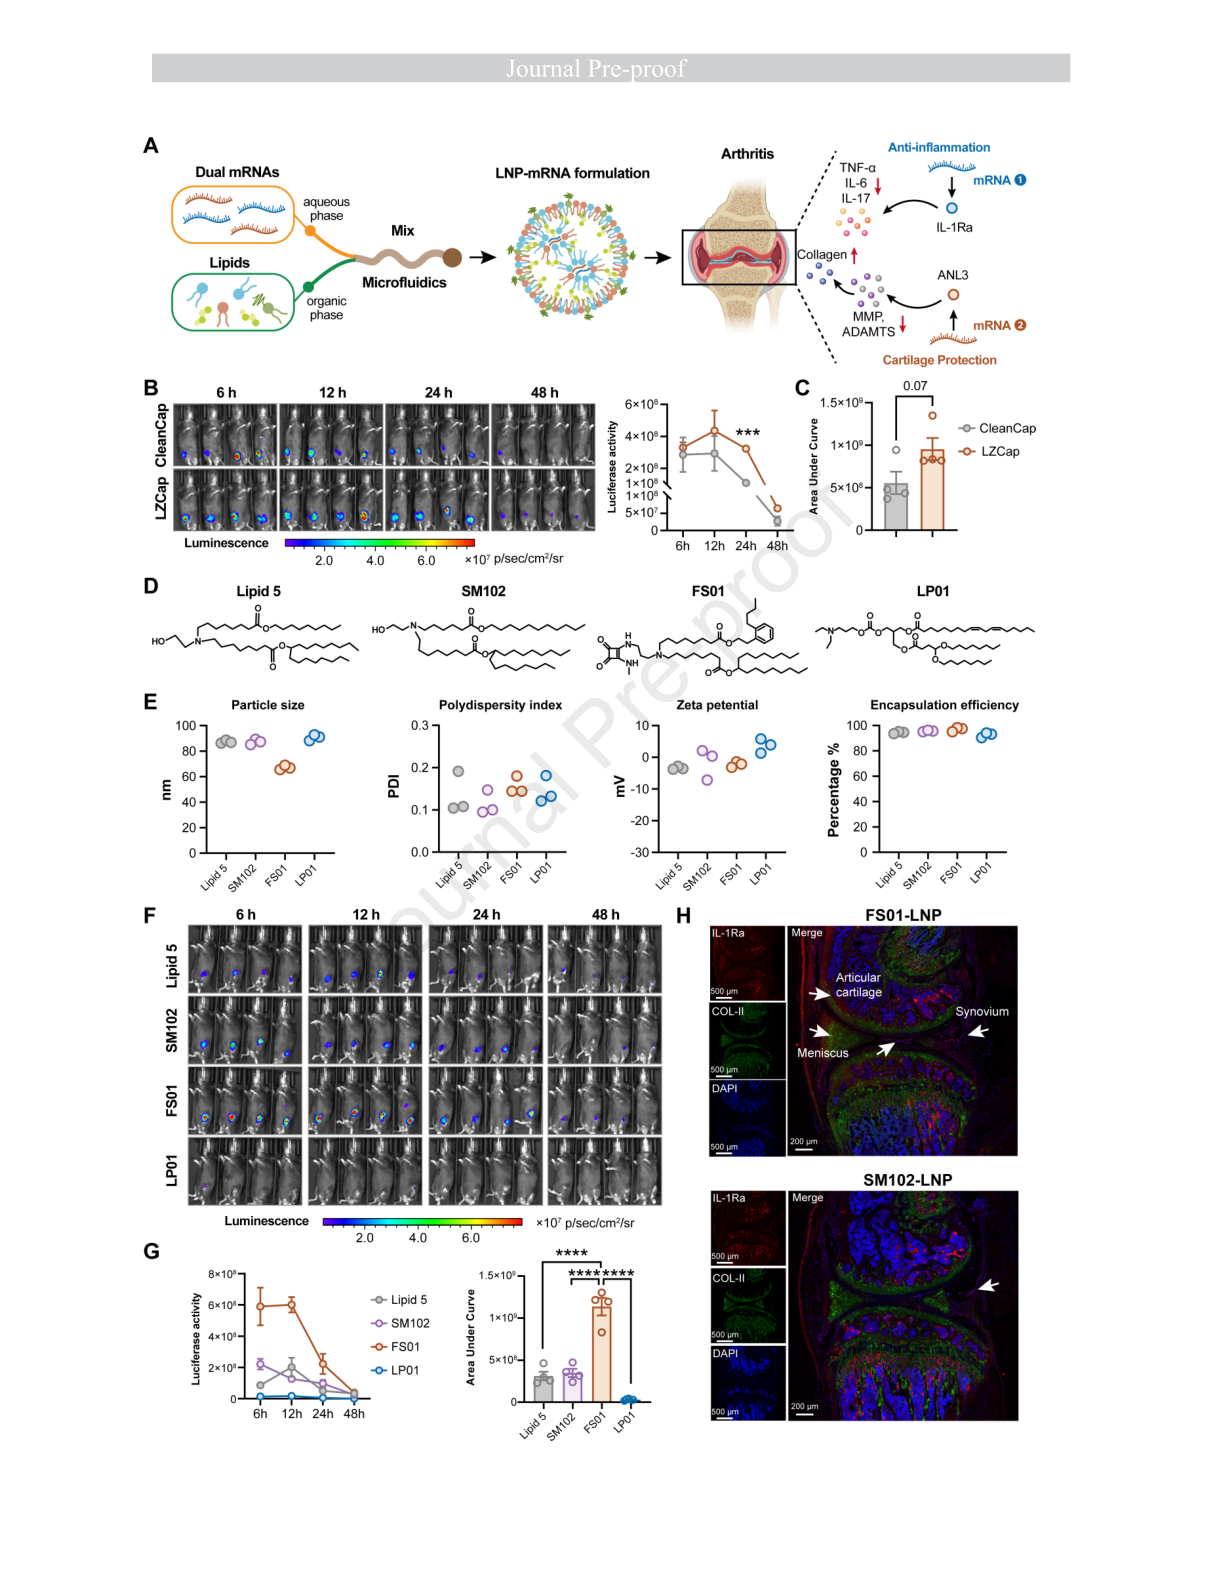
| FS01 screening particle size | Approximately 67 nm (main Results). Separate therapeutic formulation measurements are listed below. |
Editable component mass calculator
Calculate masses from total lipid amount. Default values follow the Methods composition; calculated values are not experimental measurements.
| Component | MW | Molar ratio | Calculated mass (mg) |
|---|---|---|---|
| FS01 | |||
| DSPC | |||
| Cholesterol | |||
| DMG-PEG2000 |
DMG-PEG2000 MW: 2507. Component mass (mg) = total µmol × normalized molar fraction × MW / 1000.
Measured therapeutic formulation properties
| Parameter | IL-1Ra mRNA | ANL3 mRNA | IL-1Ra + ANL3 mRNA |
|---|---|---|---|
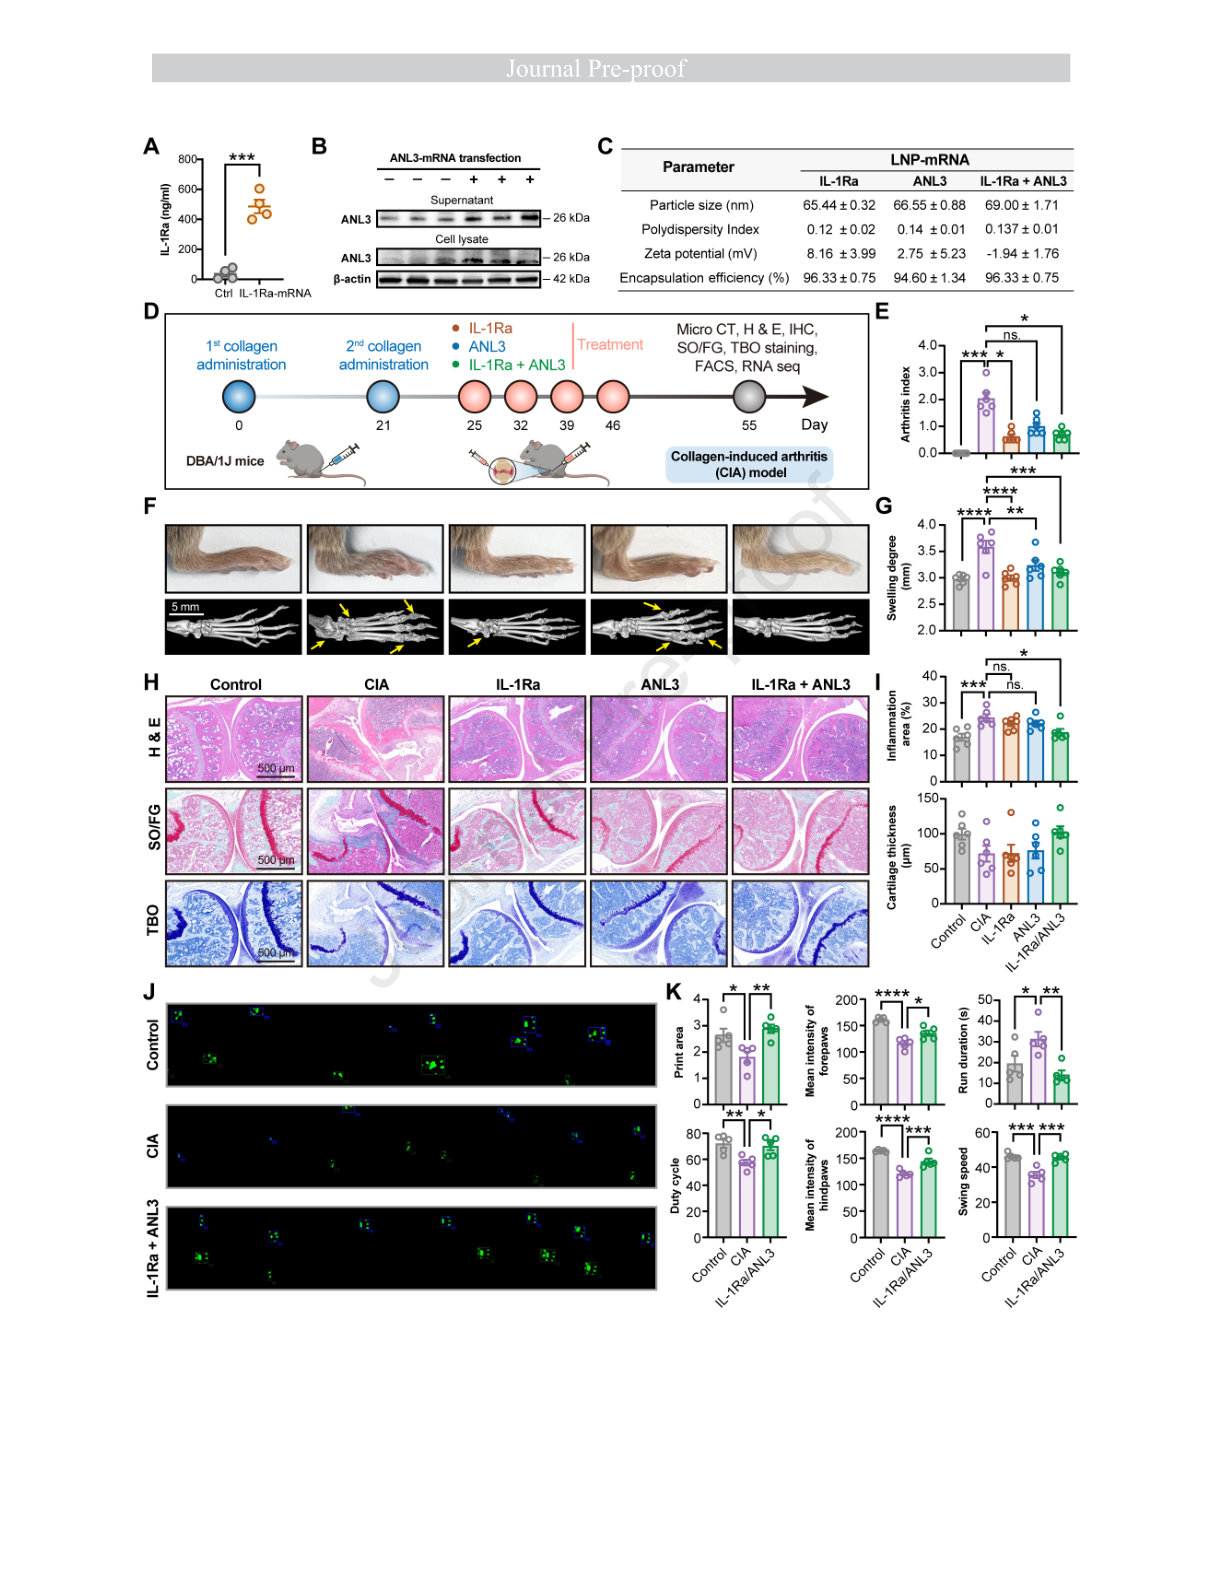
| Particle size (nm) | 65.44 ± 0.32 | 66.55 ± 0.88 | 69.00 ± 1.71 |
| PDI | 0.12 ± 0.02 | 0.14 ± 0.01 | 0.137 ± 0.01 |
| Zeta potential (mV) | 8.16 ± 3.99 | 2.75 ± 5.23 | −1.94 ± 1.76 |
| Encapsulation efficiency (%) | 96.33 ± 0.75 | 94.60 ± 1.34 | 96.33 ± 0.75 |
Transcribed from main Figure 2C. Reported ± values are preserved; this table does not infer an SD/SEM definition not specified in that panel.
Cell and animal performance
| Study | Model / cargo | Finding | Interpretation and source |
|---|---|---|---|
| Lead-lipid comparison | Male C57BL/6 mice; intra-articular Fluc mRNA; n=4/group | FS01 had higher local luciferase expression and AUC than Lipid 5, SM-102 and LP01. | Matched 5 µg mRNA comparison; 6–48 h observation. No numerical fold advantage is inferred from the graph. Fig. 1F–G; Methods. |
| Joint tissue delivery | IL-1Ra mRNA; joint sections collected at 24 h | Greater IL-1Ra staining in synovium, meniscus and cartilage than the SM-102 formulation. | Local injection study, not evidence of systemic joint targeting. Fig. 1H. |
| Collagen-induced arthritis | DBA/1J mice; n=6/group; gait analysis n=5/group | Combined IL-1Ra/ANL3 formulation reduced joint inflammation and preserved cartilage; histology, micro-CT and gait were evaluated. | Single-cargo groups received 2 µg; combination received 4 µg total. Total mRNA dose was not matched, so this is not an isolated demonstration of equal-dose synergy. Fig. 2. |
| Inflammation and cartilage markers | CIA joint tissue and immune readouts | Reported reductions in inflammatory and matrix-degrading markers, with preservation of cartilage-associated readouts. | Complete payload-loaded formulation; do not attribute the effect to FS01 alone. Figs. 3–4. |
| Spontaneous rheumatoid arthritis | TNF-transgenic mice; 5–6/group according to treatment arm | Combination therapy improved reported joint pathology and cartilage-associated outcomes. | Preclinical model; monotherapy and combination groups again used different total mRNA amounts. Fig. 5. |
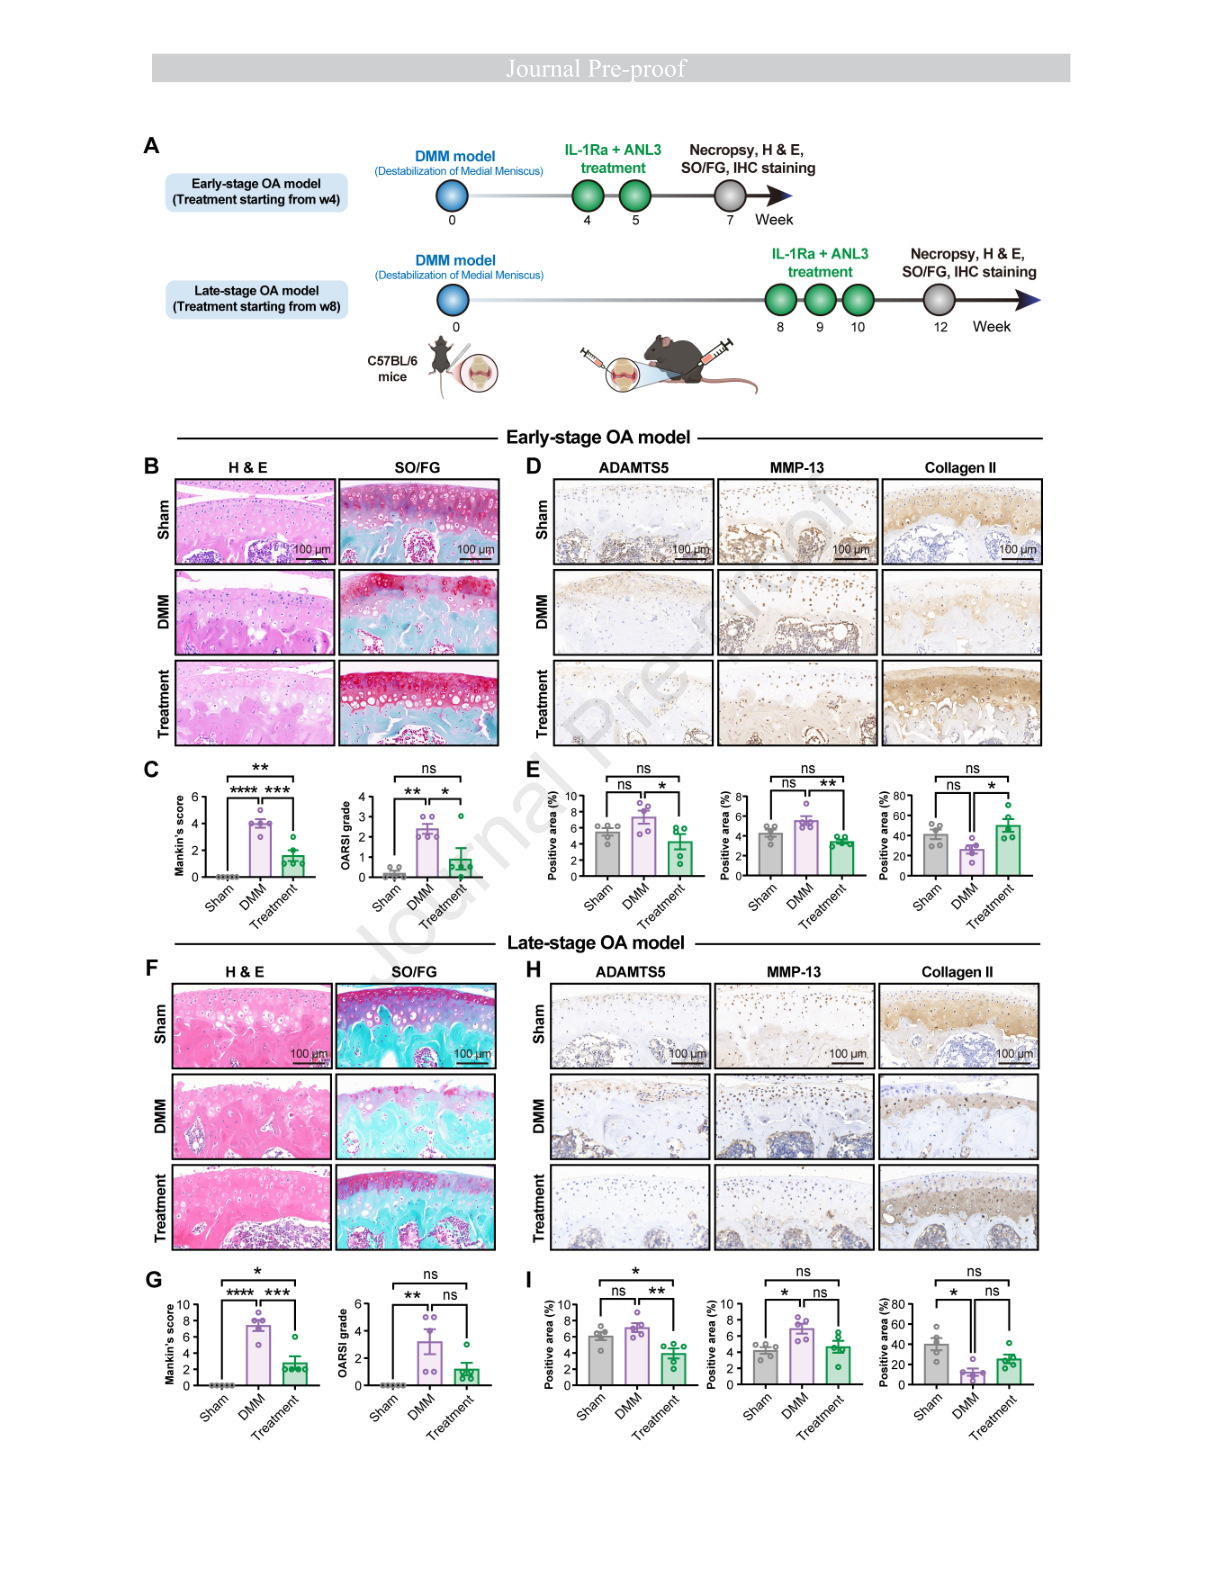
| Surgical osteoarthritis | Early- and late-stage DMM mouse models; n=5/group | Improved cartilage histology and Mankin/OARSI scores; ADAMTS5, MMP-13 and collagen II were examined. | Combination formulation; 4 µg total mRNA per injection. Fig. 6. |
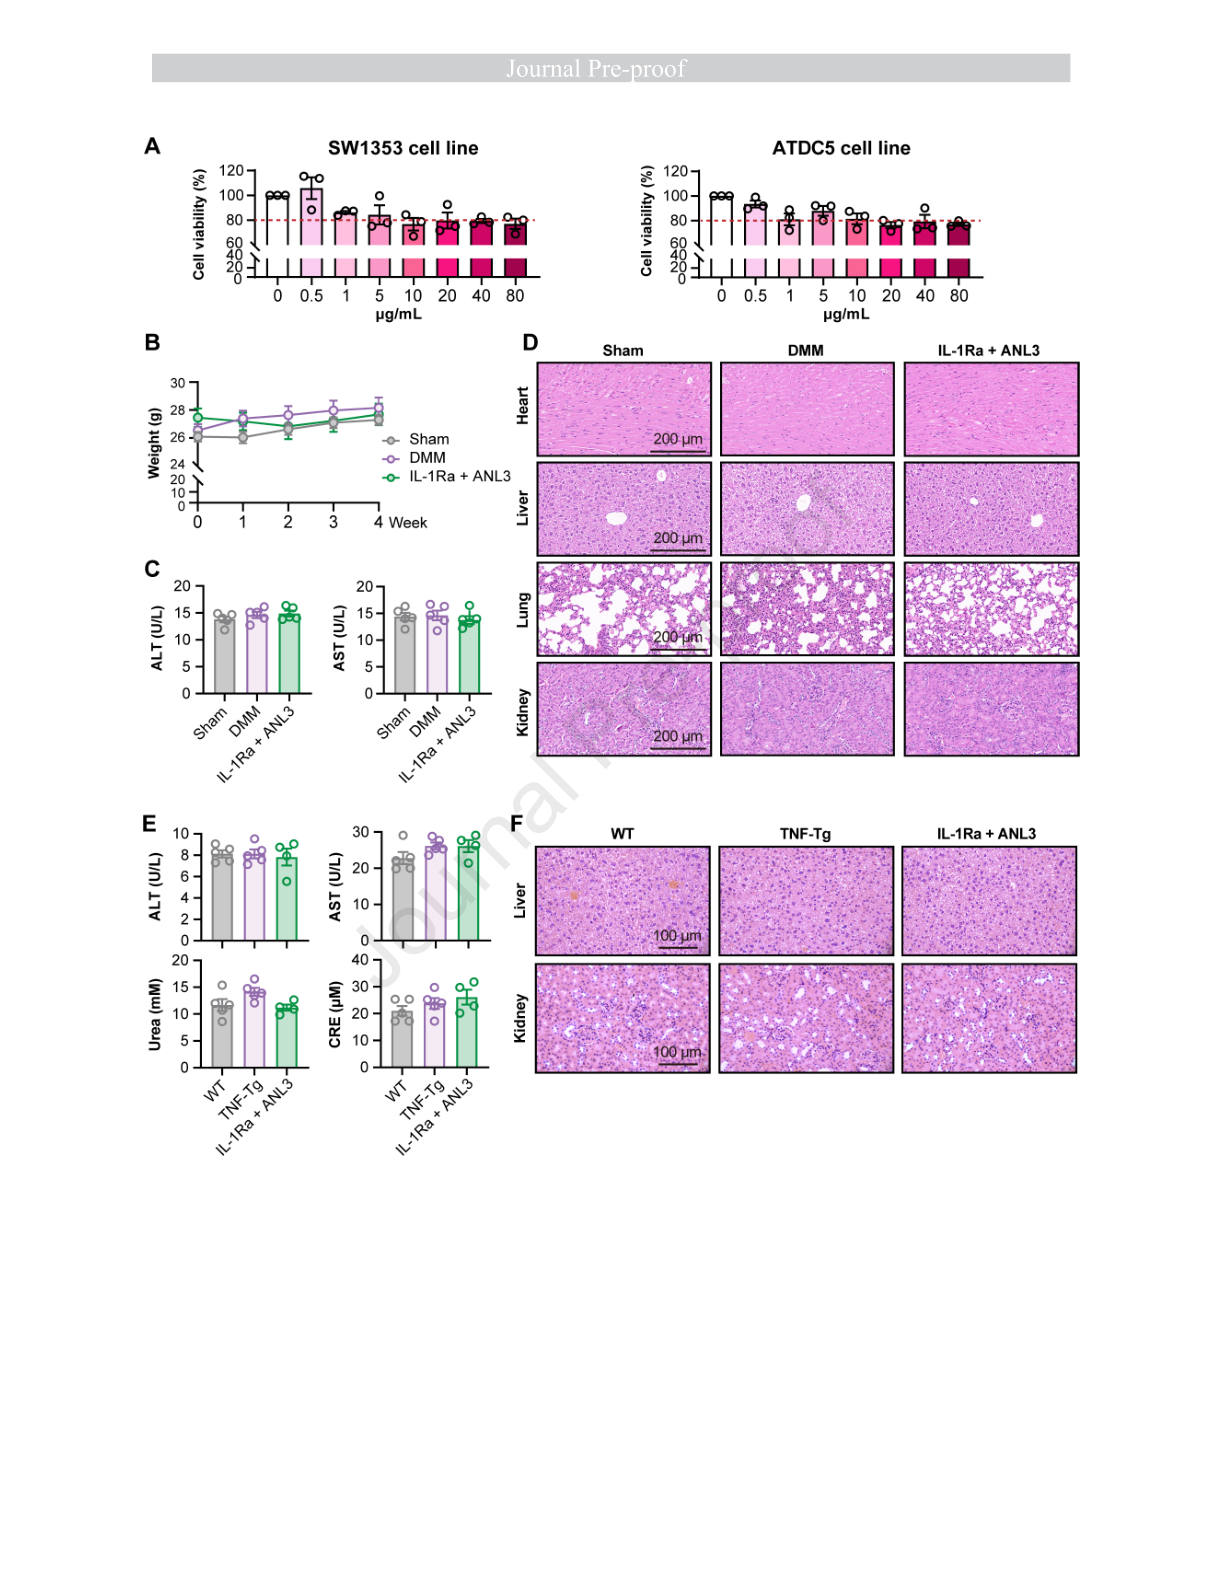
| Cell and animal tolerability | SW1353 / ATDC5 cells, 24 h; treated OA and TNF-Tg mice | Cell viability, body weight, serum chemistry and organ histology were assessed; the authors reported a favorable preliminary tolerability profile. | Study-specific observations do not establish clinical safety or long-term safety. Fig. 7. |
Evidence boundary: mouse and cell studies; no human efficacy established. The supplied file is a journal pre-proof. Supplementary figures and underlying raw data were not supplied for independent verification. No synthesis procedures, NMR spectra or chemical analytical data are reproduced.
Original study figures
References
- Wang G, et al. A Combinatorial mRNA Therapy for Treating Rheumatoid Arthritis and Osteoarthritis by Inhibiting Inflammation and Preventing Cartilage Degeneration. Molecular Therapy (2026), journal pre-proof. DOI: 10.1016/j.ymthe.2026.10.021. Main source for the study tables and figures on this page.
- Guo K, et al. A novel ionizable lipid with comprehensive improvements in transfection potency, immune profile and safety of lipid nanoparticle. Journal of Controlled Release 386, 114126 (2025). DOI: 10.1016/j.jconrel.2025.114126. Earlier FS01 publication cited by Wang et al.; not used to fill missing N/P values.
- CN120208802A, published 27 June 2025. FS01 structure: paragraphs 0116–0119, PDF page 14; formulation component order: paragraph 0121. Chemical preparation details are not reproduced here.