Lipid10/cholesterol/DSPC/PEG-DMG/DSPE-PEG-maleimide = 50:38:10:1.9:0.1 molar, followed by anti-CD38 THB-7 conjugation. This is required context for the bone-marrow multiple-myeloma experiments.
Do not attribute antibody-mediated targeting to naked Lipid10. · Main PDF pp.10-11, Methodssales@dcchemicals.com
EA-PIP (Lipid 10)
Formulation & Performance
Literature-reported formulation composition
| Component | mol% | Role |
|---|---|---|
| EA-PIP (Lipid 10) | 50 | Ionizable lipid |
| Cholesterol | 38.5 | Sterol |
| DSPC | 10 | Helper phospholipid |
| DMG-PEG2000 | 1.5 | PEG lipid |
| Reported total | 100 | Source values retained |
Component molecular weights and calculated amounts
Composition retained from the cited study below. Research planning aid only. Results cover lipid component weights and do not include RNA, buffer, solvent, process loss or an N/P ratio.
| Component | Molecular weight | Molar parts | Normalized mol% | Amount (µmol) | Weight (mg) |
|---|---|---|---|---|---|
| EA-PIP (Lipid 10) | 50.000 | 80.4408 | 57.2892 | ||
| Cholesterol | 38.500 | 61.9395 | 23.9489 | ||
| DSPC | 10.000 | 16.0882 | 12.7120 | ||
| DMG-PEG2000 | 1.500 | 2.4132 | 6.0500 |
Calculated total: 100.0000 mg lipid.
Calculated catalog planning quantities; RNA, solvent and process loss are excluded. DMG-PEG2000 uses 2507. Component mass = total lipid mass × molar parts × molecular weight / sum(parts × molecular weight). This conversion does not infer N/P.
Literature-reported performance for the cited formulation
Literature-reported4.17%Unmodified L10 LNP; 0.1 microgram/mL total RNA; XTT, normalized to negative-control siRNA · 72 hMain PDF p.2 and Fig.1G
Literature-reported73.5%CAG cells; 0.1 microgram/mL siRNA · 24 hMain PDF p.2 and Fig.2A
Additional reported findings
Literature Data DisclaimerAll formulation parameters and performance values shown in this section are derived from the cited publication and are provided for reference only. These results were obtained using the specific materials, formulation process, cargo, dose, analytical method, model and administration route described in that study. Unless otherwise stated, the data were not generated or independently verified by DC Chemicals. DC Chemicals supplies the lipid compound only and does not guarantee that customers will reproduce the reported LNP properties or biological performance.
The administration route shown above was used in the cited study and is not a clinical-use instruction or recommendation by DC Chemicals.
The administration route shown above was used in the cited study and is not a clinical-use instruction or recommendation by DC Chemicals.
Cited literature for this formulation and performance datasetDelivery of Therapeutic RNA to the Bone Marrow in Multiple Myeloma Using CD38-Targeted Lipid Nanoparticles. DOI: 10.1002/advs.202301377 DOI: 10.1002/advs.202301377
This is the unmodified 50:38.5:10:1.5 formulation. Anti-CD38 targeting uses 50:38:10:1.9:0.1 with DSPE-PEG-maleimide and conjugated antibody. Methods wording about N:P order is ambiguous; no numerical N/P is assigned.
This is the unmodified 50:38.5:10:1.5 formulation. Anti-CD38 targeting uses 50:38:10:1.9:0.1 with DSPE-PEG-maleimide and conjugated antibody. Methods wording about N:P order is ambiguous; no numerical N/P is assigned.
Published study figures
Original publication figures illustrating the cited formulation and biological results. Select an image to view it at full size.
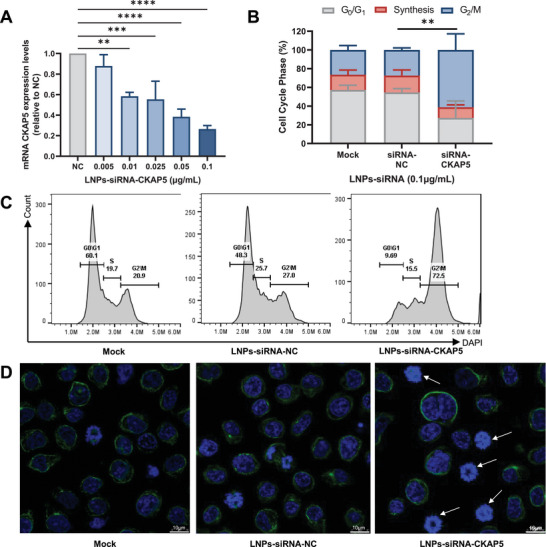
Figure 2 — Original gene-expression, flow-cytometry and microscopy panels show CKAP5 silencing and cell-cycle arrest in CAG multiple-myeloma cells following delivery by lipid-10 LNPs
Original gene-expression, flow-cytometry and microscopy panels show CKAP5 silencing and cell-cycle arrest in CAG multiple-myeloma cells following delivery by lipid-10 LNPs. CKAP5 mRNA at 24 h; cell cycle and microscopy at 36 h. Mock and negative-control siRNA are shown. Three independent experiments for panels A-B.
Tarab-Ravski D et al. (2023). Cellular effects of lipid-10 LNP-delivered siRNA. Original article / figure · CC BY 4.0. Original repository figure file reproduced without modification. The cell-cycle label “Synthesis” refers to S phase, not lipid synthesis.
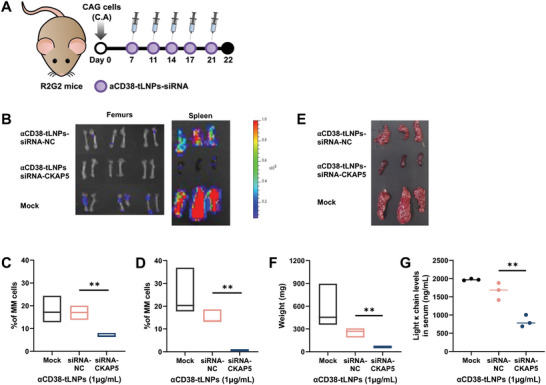
Figure 6 — Original imaging and quantitative readouts show effects of anti-CD38-targeted lipid-10 LNPs delivering CKAP5 siRNA in a multiple-myeloma mouse model
Original imaging and quantitative readouts show effects of anti-CD38-targeted lipid-10 LNPs delivering CKAP5 siRNA in a multiple-myeloma mouse model. Results depend on both the targeted formulation and therapeutic cargo. R2G2 xenograft mice; bone-marrow and spleen assessment on day 22 after tumor inoculation; three mice per group in each efficacy study. Mock and negative-control siRNA groups retained.
Tarab-Ravski D et al. (2023). Antitumor effects of anti-CD38 targeted lipid-10 LNPs. Original article / figure · CC BY 4.0. Original repository figure file reproduced without modification.