EGFP microscopy showed expression mainly in hepatocytes after IV dosing.
0.5 or 1.5 mg/kg EGFP mRNA; 24 h · Primary article and SI imagingsales@dcchemicals.com
CL4F8-6
Formulation & Performance
Literature-reported formulation composition
| Component | mol% | Role |
|---|---|---|
| CL4F8-6 | 50 | Ionizable lipid |
| Cholesterol | 38.5 | Sterol |
| DSPC | 10 | Helper phospholipid |
| DMG-PEG2000 | 1.5 | PEG lipid |
| Reported total | 100 | Source values retained |
Component molecular weights and calculated amounts
Composition retained from the cited study below. Research planning aid only. Results cover lipid component weights and do not include RNA, buffer, solvent, process loss or an N/P ratio.
| Component | Molecular weight | Molar parts | Normalized mol% | Amount (µmol) | Weight (mg) |
|---|---|---|---|---|---|
| CL4F8-6 | 50.000 | 74.6653 | 60.3557 | ||
| Cholesterol | 38.500 | 57.4923 | 22.2294 | ||
| DSPC | 10.000 | 14.9331 | 11.7994 | ||
| DMG-PEG2000 | 1.500 | 2.2400 | 5.6156 |
Calculated total: 100.0000 mg lipid.
Calculated catalog planning quantities; RNA, solvent and process loss are excluded. DMG-PEG2000 uses 2507. Component mass = total lipid mass × molar parts × molecular weight / sum(parts × molecular weight). This conversion does not infer N/P.
Literature-reported performance for the cited formulation
Literature-reported88.78 nm; PDI 0.022; EE 99.4%; pKa 6.14Fresh CL4F8-6 LNPSI Table S1
Literature-reportedHighest among the tested branched-lipid library0.1 mg/kg Fluc mRNA IV; 6 hPrimary article Fig. 5
Literature-reported77%2.5 mg/kg total RNA IV; Cas9 mRNA:sgTTR = 1:2 w/w · Day 30Primary article Fig. 6
Literature-reported54%2.5 mg/kg total RNA IV · Day 30Primary article Fig. 6
Literature-reportedNot detectedsgTTR and sgGFP control groups; n=3SI Fig. S8
Selected CL4F8-6 study findings
| Experiment | Condition | Reported result |
|---|---|---|
| Particle characterization | Fresh formulation | 88.78 nm; PDI 0.022; EE 99.4%; pKa 6.14 |
| Reporter mRNA | 0.1 mg/kg IV; liver at 6 h | Highest expression in the branched-lipid library |
| CRISPR editing | 2.5 mg/kg total RNA IV; day 30 | 54% liver editing; 77% serum TTR reduction |
| Storage | 4 C; six months | Particle size and EE unchanged versus initial in the reported study |
Primary article Figs. 5-6; SI Table S1 and Fig. S5.
Additional reported findings
CL4F8-6 LNP particle size and encapsulation efficiency were reported unchanged after six months at 4 C.
Study formulation · Primary article and SI Fig. S5a-cLiterature Data DisclaimerAll formulation parameters and performance values shown in this section are derived from the cited publication and are provided for reference only. These results were obtained using the specific materials, formulation process, cargo, dose, analytical method, model and administration route described in that study. Unless otherwise stated, the data were not generated or independently verified by DC Chemicals. DC Chemicals supplies the lipid compound only and does not guarantee that customers will reproduce the reported LNP properties or biological performance.
The administration route shown above was used in the cited study and is not a clinical-use instruction or recommendation by DC Chemicals.
The administration route shown above was used in the cited study and is not a clinical-use instruction or recommendation by DC Chemicals.
Cited literature for this formulation and performance datasetHashiba K, et al. Branching Ionizable Lipids Can Enhance the Stability, Fusogenicity, and Functional Delivery of mRNA. Small Science. 2023;3(1):2200071. DOI: 10.1002/smsc.202200071
CL4F8-6 single-lipid formulation results are kept separate from mixed-lipid experiments and other CL4F library members.
CL4F8-6 single-lipid formulation results are kept separate from mixed-lipid experiments and other CL4F library members.
Published study figures
Original publication figures illustrating the cited formulation and biological results. Select an image to view it at full size.
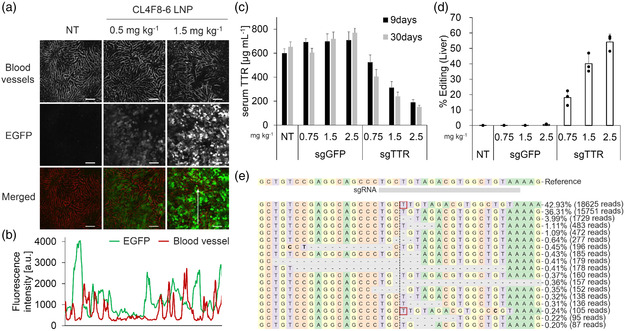
Figure 6 — CL4F8-6 LNPs: liver reporter expression and TTR gene-editing outcomes in mice
CL4F8-6 LNPs: liver reporter expression and TTR gene-editing outcomes in mice. The original microscopy panels show hepatic EGFP expression, while the graphs show serum TTR and liver editing measured in separate RNA-cargo experiments. EGFP panels: 0.5 or 1.5 mg/kg, assessed at 24 h. Editing panels: 0.75, 1.5 or 2.5 mg/kg total RNA; Cas9 mRNA/sgRNA 1:2 by weight; serum TTR at days 9 and 30 and liver editing at day 30; n = 3.
Reproduced from Hashiba et al., Small Science 3, 2200071 (2023), Figure 6. © 2022 The Authors. CC BY 4.0. Original article / figure · CC BY 4.0. Complete original figure; no panels or data altered.