
Formulation & Performance
Three enzyme-replacement mRNA programs · Liver expression and disease biomarkers · Separate formulation and dose records
The publication explicitly identifies SM-86 but does not disclose its chemical structure. The existing catalog structure and Lipid 5 alias are retained; the paper is not a verification of the supplied commercial batch.
Formulation components and molecular-weight conversion
| Component | DC Chemicals product | Molecular weight | Molar ratio | Mass at 1 µmol total lipid (mg) |
|---|---|---|---|---|
| SM-86 | DC31024 | 710.165 | Not disclosed | Not calculable from disclosed data |
| DSPC | DC57005 | 790.15 | Not disclosed | Not calculable from disclosed data |
| Cholesterol | DCD-041 | 386.65 | Not disclosed | Not calculable from disclosed data |
| OL-56 (PEG-lipid) | Not uniquely mapped | Not established | Not disclosed | Not calculable from disclosed data |
The four components are explicitly named, but their molar proportions, N/P ratio and lipid:RNA mass ratio are not disclosed. OL-56 cannot be replaced by DMG-PEG2000 when describing this study. Supplementary Table 9 separately lists SM-86/OL-56 and SM-86/DMG formulations; these records are not merged.
Component mass calculator
The source does not disclose all inputs; missing fields are intentionally blank. Enter your own values to calculate a research scenario. Molecular weights and ratios are editable. Results are calculated, not measured study data. No N/P or RNA dose is inferred.
| Component | MW | Molar ratio | Mass (mg) | Mass % |
|---|---|---|---|---|
| SM-86 | ||||
| DSPC | ||||
| Cholesterol | ||||
| OL-56 (PEG-lipid) |
Three formulations, three distinct cargos
| Program / indication | RNA cargo | Diameter | PDI | Encapsulation |
|---|---|---|---|---|
| mRNA-3927 / propionic acidemia | hPCCA + hPCCB, 1:1 RNA molar ratio | 70 nm | 0.14 | >96% |
| mRNA-3705 / methylmalonic acidemia | hMUT | 71 nm | 0.07 | 97% |
| mRNA-3210 / phenylketonuria | hPAH | 77 nm | 0.13 | 95% |
Source: main article, Methods, mRNA synthesis and formulation, PDF p. 8. Particle values belong to the corresponding complete formulation.
Formulation context
| Parameter | Reported value |
|---|---|
| Preparation platform | Microfluidic mixing of ethanolic lipids with aqueous mRNA |
| Aqueous:ethanol volume ratio | 3:1 |
| Aqueous buffer | 25 mM sodium acetate, pH 5 |
| Final dispersion | 20 mM Tris, pH 7.5; 8% sucrose; 1 mM DTPA |
| Total flow rate / N/P / lipid:RNA mass ratio | Not disclosed |
| Component molar percentages / OL-56 molecular weight | Not disclosed |
Source: Methods, PDF p. 8. Reported formulation context, not a validated manufacturing instruction for the commercial lipid.
Propionic acidemia: sustained biomarker response
| Study element | Evidence |
|---|---|
| Model | Pcca−/−(A138T) mice |
| Treatment | mRNA-3927, 0.5 mg total RNA/kg IV on days 0 and 28 |
| Biomarkers | Plasma 2-methylcitrate, 3-hydroxypropionate and C3/C2 ratio |
| Response | Biomarker reduction lasted approximately 3–4 weeks after the first dose; repeat treatment produced another response |
| Replicates | n = 6 per group in the pharmacodynamic experiment |
| Negative result | Liver PCC activity increased numerically, but the reported comparison was not statistically significant |
Source: Figure 2 and Supplementary Table 2. The 1 and 2 mg/kg single-dose pharmacokinetic experiments are separate from this 0.5 mg/kg pharmacodynamic study.
Methylmalonic acidemia: protein and enzyme activity
| 24-hour endpoint | Control (n=4) | 0.2 mg RNA/kg IV (n=5) | 0.5 mg RNA/kg IV (n=4) |
|---|---|---|---|
| Liver hMUT protein (ng/mg protein) | 0.0 ± 0.0 | 45.0 ± 42.2; p=0.0836 | 70.4 ± 24.2; p=0.0136 |
| Liver MUT activity (nmol/min/mg protein) | 2.8 ± 0.2 | 5.7 ± 2.8; p=0.4577 | 10.7 ± 6.5; p=0.0317 |
| Plasma MMA, baseline → day 1 (µM) | 892 ± 241 → 1260 ± 280 | 614 ± 190 → 425 ± 422 | 589 ± 206 → 114 ± 20 |
Mut−/−;TgINS-CBA-G715V mice; mean ± SD. Protein and activity p values compare with control. The high-dose within-group plasma comparison has p=0.0201; the paper reports a 78 ± 3.2% reduction from baseline. One partially dosed high-dose animal was excluded. Source: Figure 3 and Supplementary Table 4, SI p. 5.
Methylmalonic acidemia: tissue biomarker response
| Tissue MMA at 24 h (nmol/g) | Control | 0.5 mg RNA/kg IV | p versus control |
|---|---|---|---|
| Liver | 4662.5 ± 1752.2 | 7.9 ± 15.8 | 0.0011 |
| Kidney | 3480.0 ± 1612.1 | 189.7 ± 128.9 | 0.0052 |
Mean ± SD; n=4 per displayed group. Tissue metabolite reduction does not itself demonstrate mRNA transfection of those tissues. Source: Supplementary Table 4.
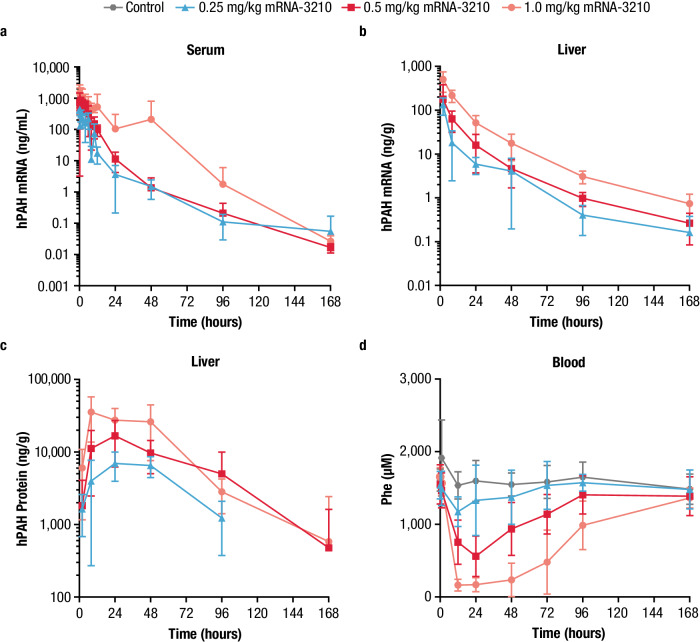
Phenylketonuria: hepatic expression and blood phenylalanine
| Single IV dose (mg RNA/kg) | Peak liver hPAH (ng/g) | Time of protein peak | Minimum blood Phe (µM) |
|---|---|---|---|
| 0.25 | 6950 | 24 h | 1105 ± 209 |
| 0.5 | 16,700 | 24 h | 561 ± 279 |
| 1.0 | 35,600 | 8 h | 138 ± 78 |
PAHenu2 mice. Phe mean ± SD, n=8 per group; protein sampling group sizes vary by time point (Figure 4). Blood Phe returned toward baseline by 168 h. The low-dose minimum is 1105 in Supplementary Table 7 and 1110 in the main text; this table follows the SI. Source: Figure 4 and Supplementary Table 7, SI p. 8.
Tolerability and interpretation
| Evidence | Scope |
|---|---|
| Reported rat NOAEL | mRNA-3927: 3 mg/kg; mRNA-3705: 5 mg/kg; mRNA-3210: 3 mg/kg |
| What the values describe | Study-program-specific complete RNA-LNP formulations in Sprague–Dawley rats (main Table 1), not standalone SM-86 toxicity |
| Nonhuman-primate records | The SI inventories cynomolgus pharmacokinetic studies. An inventory entry is not evidence of therapeutic efficacy in monkeys |
| Cell data | No product-specific cell transfection ranking is assigned from this predominantly in vivo PK/PD study |
| Human relevance | Translational dose modeling is a prediction, not observed human efficacy or a human safety guarantee |
Source: main Table 1 and Supplementary Tables 8–10. Full study-specific toxicology outcomes are not reproduced in this publication.
Original study figures
Figure 2: mRNA-3927 in the PA mouse model
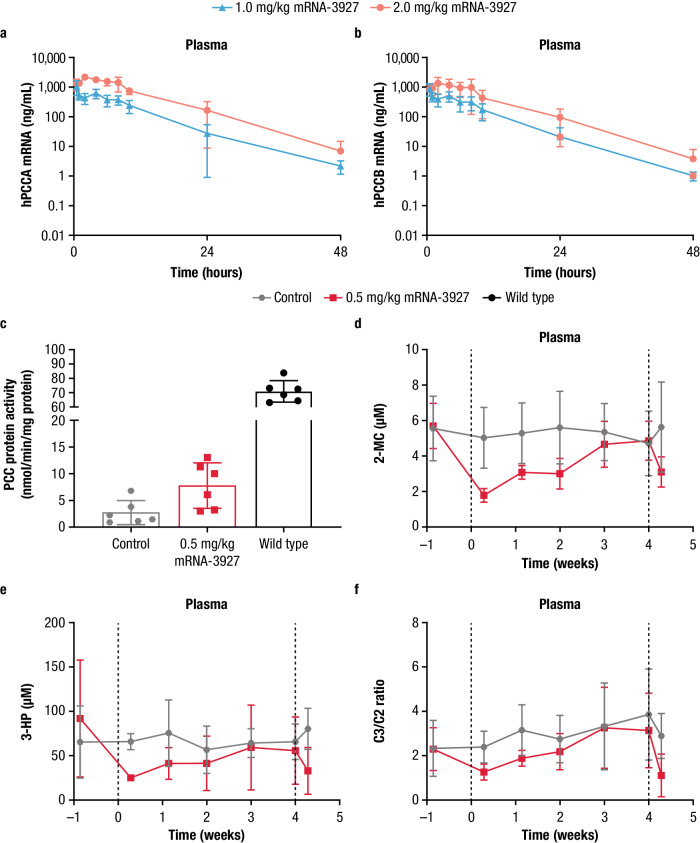
Figure 3: mRNA-3705 in the MMA mouse model
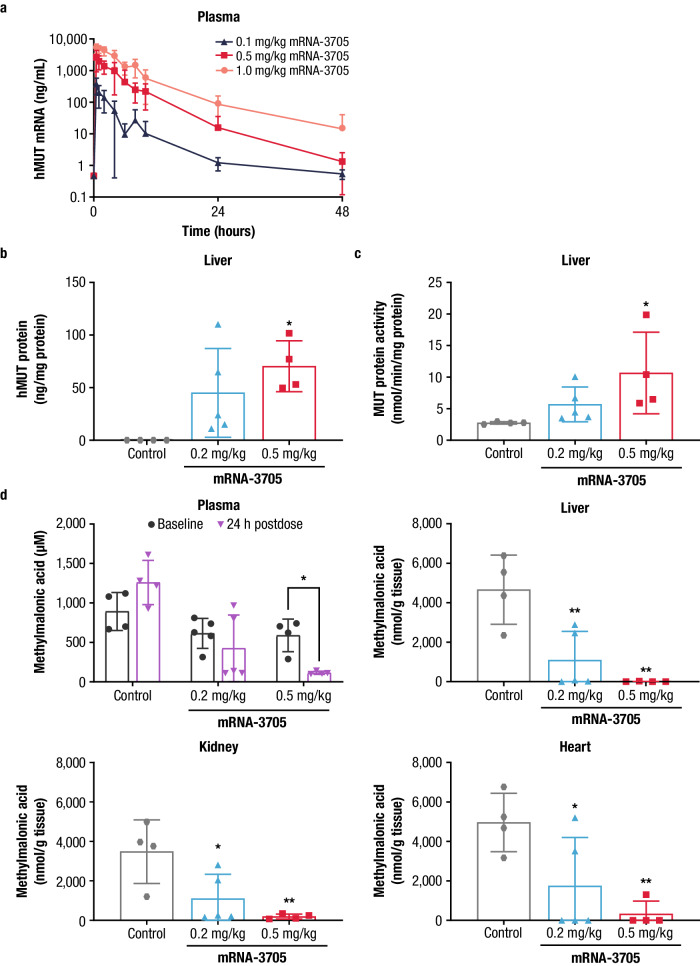
Figure 4: mRNA-3210 in the PKU mouse model
References and source locations
- Baek R, et al. Characterizing the mechanism of action for mRNA therapeutics for the treatment of propionic acidemia, methylmalonic acidemia, and phenylketonuria. Nature Communications 15, 3804 (2024).
- Supplementary Information: formulation distinctions and Tables 1–10.
- Source Data accompanying the article.