sales@dcchemicals.com
DLinDMA
Formulation & Performance
Literature-reported formulation composition
| Component | mol% | Role |
|---|---|---|
| DLin-DMA | 50 | Ionizable lipid |
| DSPC | 10 | Helper phospholipid |
| Cholesterol | 38.5 | Sterol |
| DMG-PEG2000 | 1.5 | PEG lipid |
| Reported total | 100 | Source values retained |
Component molecular weights and calculated amounts
Composition retained from the cited study below. Research planning aid only. Results cover lipid component weights and do not include RNA, buffer, solvent, process loss or an N/P ratio.
| Component | Molecular weight | Molar parts | Normalized mol% | Amount (µmol) | Weight (mg) |
|---|---|---|---|---|---|
| DLin-DMA | 50.000 | 87.1815 | 53.7101 | ||
| DSPC | 10.000 | 17.4363 | 13.7773 | ||
| Cholesterol | 38.500 | 67.1297 | 25.9557 | ||
| DMG-PEG2000 | 1.500 | 2.6154 | 6.5569 |
Calculated total: 100.0000 mg lipid.
Calculated catalog planning quantities; RNA, solvent and process loss are excluded. DMG-PEG2000 uses 2507. Component mass = total lipid mass × molar parts × molecular weight / sum(parts × molecular weight). This conversion does not infer N/P.
Literature-reported performance for the cited formulation
Published particle and ionization measurements
| Parameter | DLin-DMA result | Source |
|---|---|---|
| DLS number diameter | 62.79 and 69.72 nm | Source Data Fig.3b |
| PDI | 0.246 and 0.249 | Source Data Fig.3b |
| Encapsulation efficiency | 72.95% and 74.72% | Source Data Fig.3d |
| TNS apparent LNP pKa | 6.66 | Source Data Fig.1d |
| Zeta-potential pKa / pI | 6.15 / 6.34 | Source Data Fig.1d |
| Water-soluble analogue pKa | 8.93 | Source Data Fig. 1d |
Carrasco et al. 2021 main Table 1 and Figs.1,3; Supplementary Data 1 'Figure 1d'!B2:G7 and Supplementary Data 3 'Figure 3b'!B2:F7, 'Figure 3d'!B2:F7
The administration route shown above was used in the cited study and is not a clinical-use instruction or recommendation by DC Chemicals.
The page formulation and all particle/in vivo values use the Carrasco 2021 50:10:38.5:1.5, N/P 4 FLuc mRNA-LNP. Semple 2010 data are separately labelled as a 40 mol% PFV screen with incomplete helper-lipid composition and are not merged with the 2021 formulation.
Published study figures
Original publication figures illustrating the cited formulation and biological results. Select an image to view it at full size.
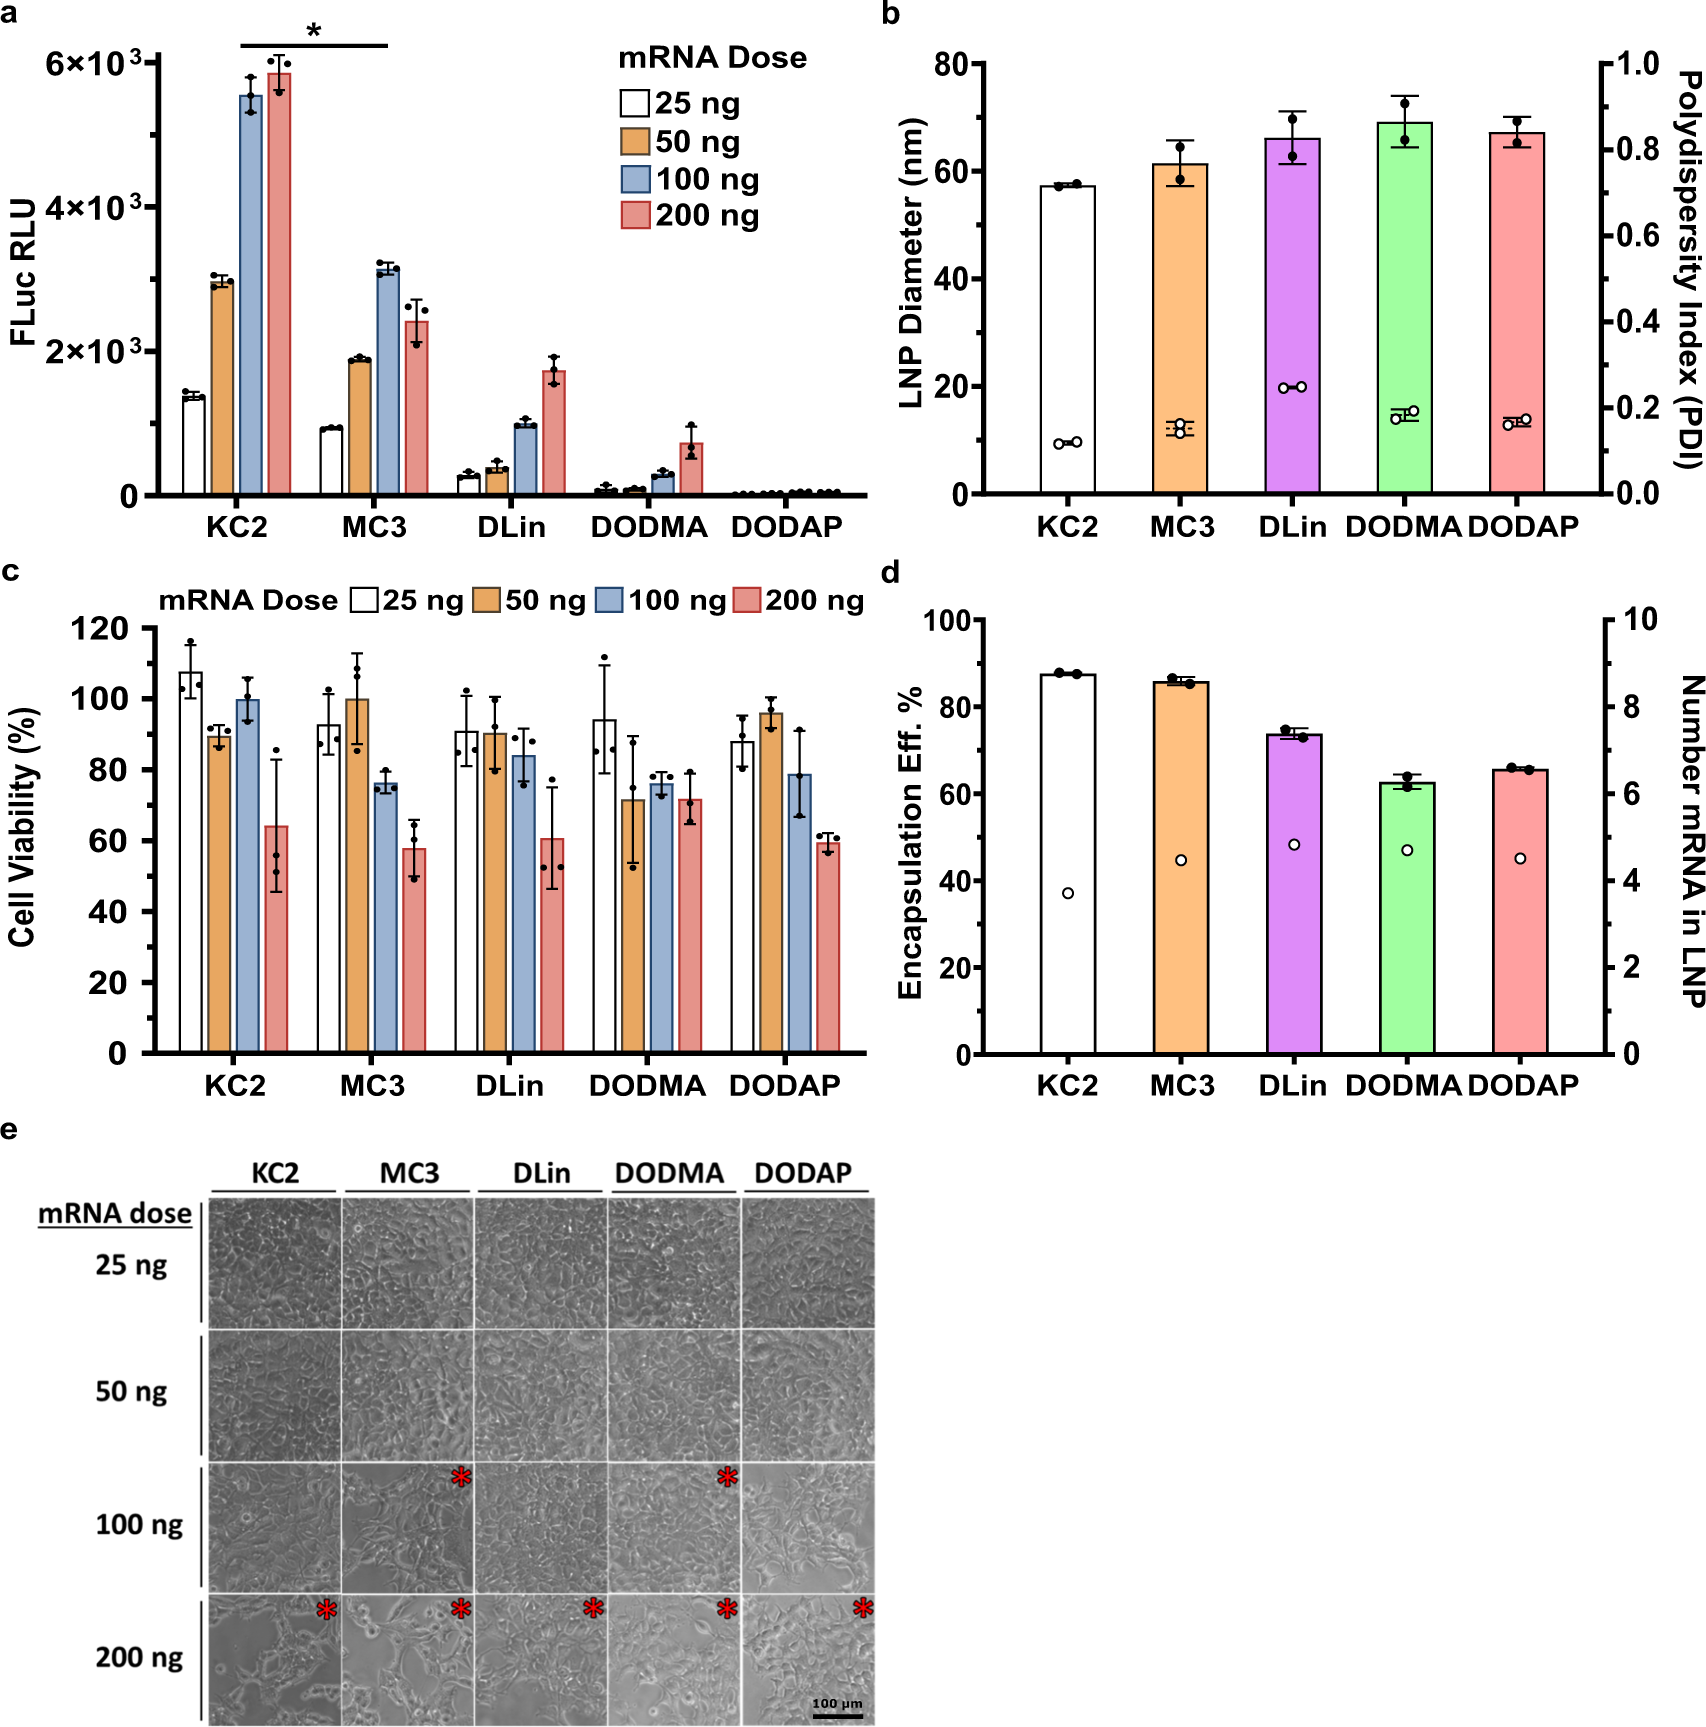
Figure 3 — Cell expression, viability and LNP characteristics
DLinDMA (labelled DLin) is compared with KC2, MC3, DODMA and DODAP. Luciferase expression and cell viability are shown across mRNA doses; the particle-size and encapsulation measurements refer to the same study formulations. HEK293 cells; FLuc mRNA; N/P 4; 25–200 ng mRNA; 24-hour cell assessment; mean ± SD, n=3.
Carrasco et al. (2021), Communications Biology, Figure 3. CC BY 4.0. Original figure unchanged. Original article / figure · CC BY 4.0. Unmodified complete original figure; displayed at responsive size.
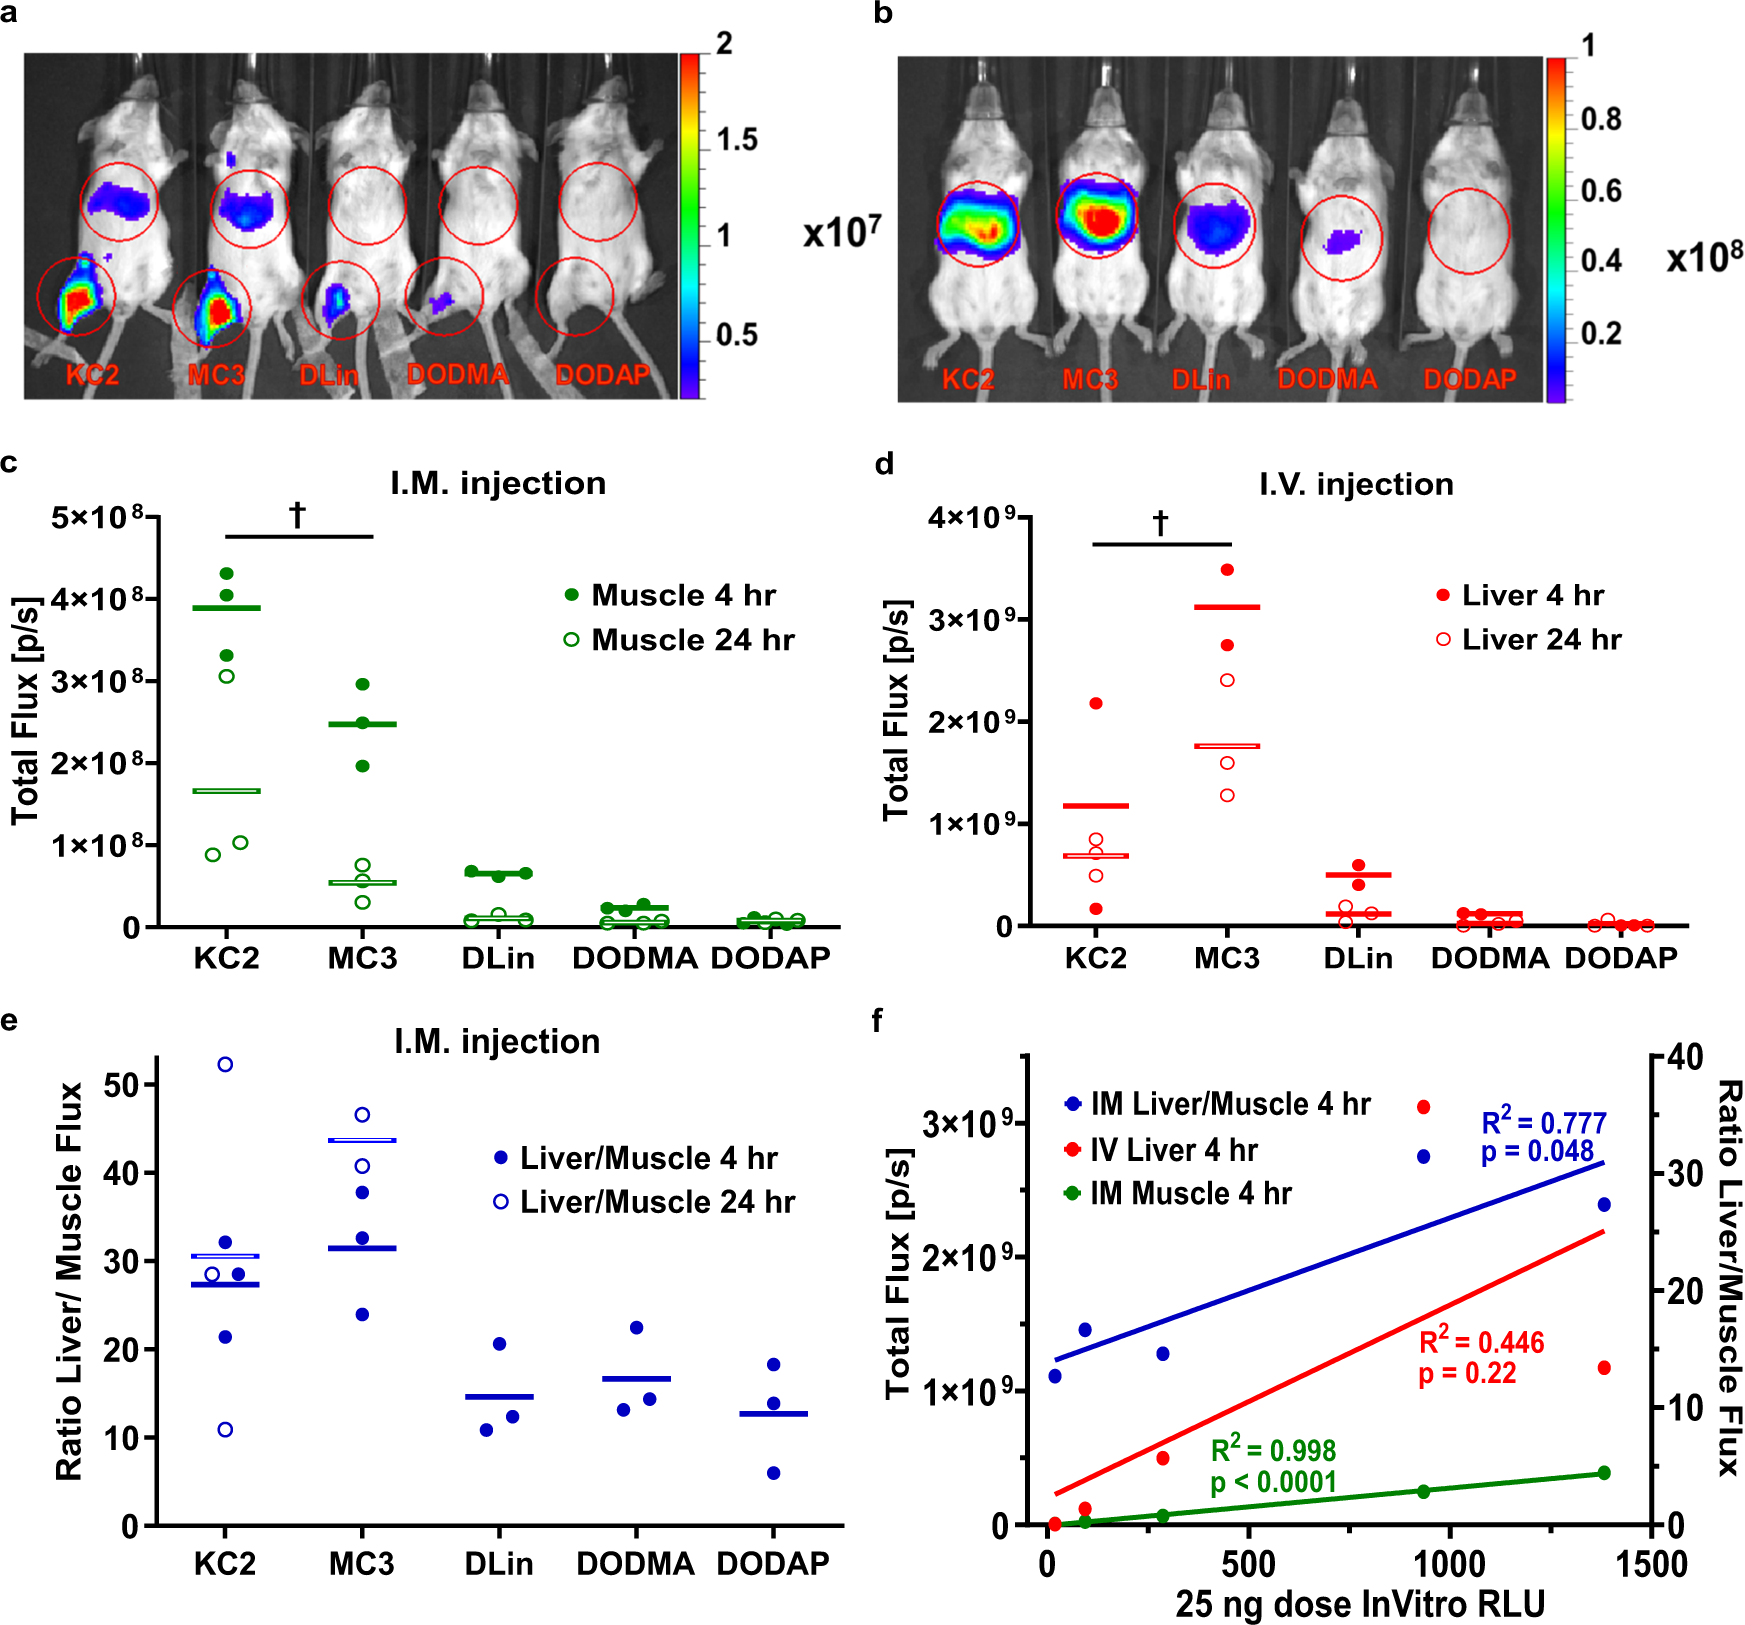
Figure 4 — Route-dependent reporter expression in mice
DLinDMA (DLin), MC3, DODMA and DODAP are individually labelled alongside KC2. The relative performance changes between intramuscular and intravenous administration; results should be read within the route and time point shown. 5 µg FLuc mRNA per mouse; N/P 4; IM or IV; measurements at 4 and 24 hours.
Carrasco et al. (2021), Communications Biology, Figure 4. CC BY 4.0. Original figure unchanged. Original article / figure · CC BY 4.0. Unmodified complete original figure; displayed at responsive size.