The 50/39/11 mol% table covers lipid core components only. To obtain the measured three-layer particles, 7 microlitres of 20 micromolar siRNA, 1 microlitre of 2 mg/mL poly-L-arginine and 5 microlitres of 5 mg/mL hyaluronic acid were added sequentially to 14.1 microlitres core suspension.
Ten minutes at room temperature after each layer · Methods 2.2sales@dcchemicals.com
DODMA
Formulation & Performance
Literature-reported formulation composition
| Component | mol% | Role |
|---|---|---|
| DODMA | 50 | Ionizable lipid |
| Cholesterol | 39 | Sterol |
| DOPE | 11 | Helper phospholipid |
| Reported total | 100 | Source values retained |
Component molecular weights and calculated amounts
Composition retained from the cited study below. Research planning aid only. Results cover lipid component weights and do not include RNA, buffer, solvent, process loss or an N/P ratio.
| Component | Molecular weight | Molar parts | Normalized mol% | Amount (µmol) | Weight (mg) |
|---|---|---|---|---|---|
| DODMA | 50.000 | 92.1335 | 57.1323 | ||
| Cholesterol | 39.000 | 71.8641 | 27.7863 | ||
| DOPE | 11.000 | 20.2694 | 15.0814 |
Calculated total: 100.0000 mg lipid.
Calculated catalog planning quantities; RNA, solvent and process loss are excluded. DMG-PEG2000 uses 2507. Component mass = total lipid mass × molar parts × molecular weight / sum(parts × molecular weight). This conversion does not infer N/P.
Literature-reported performance for the cited formulation
Literature-reported177 ± 2 nmMean ± SD; DLS Z-averageMain Results 3.1; Fig.1
Literature-reported0.18 ± 0.02Mean ± SD; DLSMain Results 3.1; Fig.1
Literature-reported90 ± 1%SYBR Gold; disrupted versus intact coresMain Results 3.1; Fig.1
Literature-reported88 ± 1%Indirect SYBR Gold accessibility estimate; not a direct recovery assayMain Results 3.1; Fig.1
Literature-reported44 ± 2% of untreated cellsThree-layer HA-LNP; siLuc 180 nM; GL261-Luc cells · 48 h · Untreated cells; scrambled-siRNA particle controlMain Results 3.1; Fig.1
Initial core versus three-layer HA-LNP
| Measurement | Initial core | Three-layer HA-LNP |
|---|---|---|
| Diameter (nm) | 146 ± 1 | 177 ± 2 |
| PDI | 0.27 ± 0.01 | 0.18 ± 0.02 |
| RNA assay (%) | 90 ± 1 (core EE) | 88 ± 1 (layer RNA; indirect) |
Results 3.1; Fig.1. Mean ± SD. Core EE and layer-associated RNA are different assays.
Additional reported findings
No significant loss of cell viability was reported for the three-layer particles at 180 nM siRNA in the 48 h GL261-Luc assay. This is not systemic or long-term safety evidence.
WST-8 viability alongside luciferase assay · Methods 2.5; Results 3.1; Fig.1DLiterature Data DisclaimerAll formulation parameters and performance values shown in this section are derived from the cited publication and are provided for reference only. These results were obtained using the specific materials, formulation process, cargo, dose, analytical method, model and administration route described in that study. Unless otherwise stated, the data were not generated or independently verified by DC Chemicals. DC Chemicals supplies the lipid compound only and does not guarantee that customers will reproduce the reported LNP properties or biological performance.
The administration route shown above was used in the cited study and is not a clinical-use instruction or recommendation by DC Chemicals.
The administration route shown above was used in the cited study and is not a clinical-use instruction or recommendation by DC Chemicals.
Cited literature for this formulation and performance datasetPassos Gibson V, et al. Modulating the Nature of Ionizable Lipids and Number of Layers in Hyaluronan-Decorated Lipid Nanoparticles for In Vitro Delivery of RNAi. Pharmaceutics. 2024;16(4):563. DOI: 10.3390/pharmaceutics16040563
Only three-layer DODMA/DODAP evidence is presented. MC3-only SF188 and core-only efficacy results are excluded. N/P 4 is the initial core ratio.
Only three-layer DODMA/DODAP evidence is presented. MC3-only SF188 and core-only efficacy results are excluded. N/P 4 is the initial core ratio.
Published study figures
Original publication figures illustrating the cited formulation and biological results. Select an image to view it at full size.
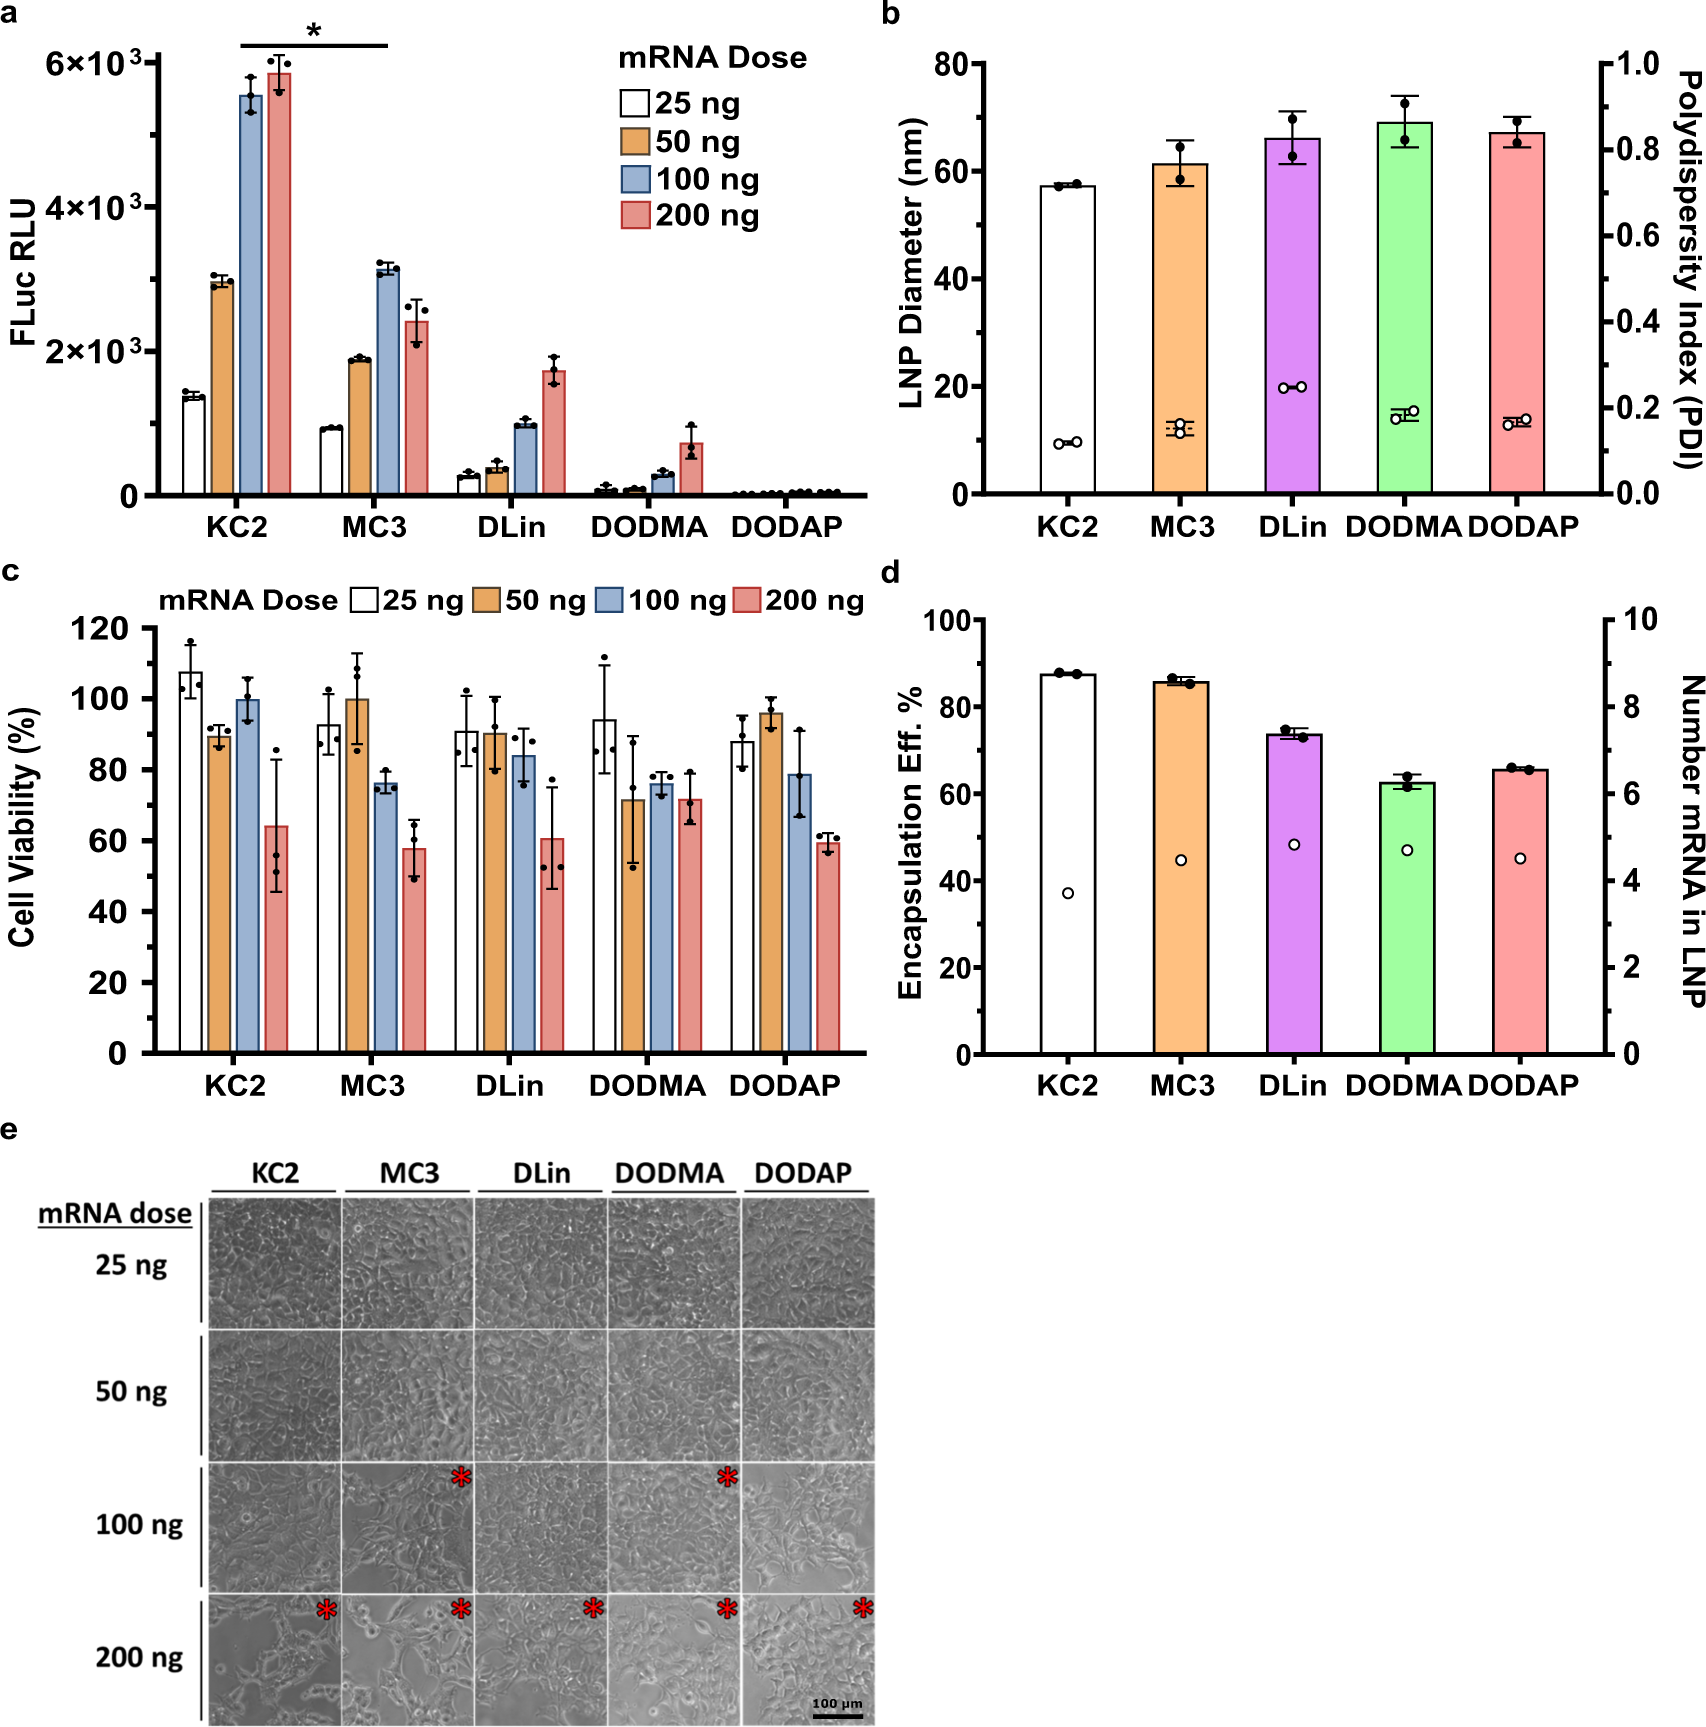
Figure 3 — Cell expression, viability and LNP characteristics
DLinDMA (labelled DLin) is compared with KC2, MC3, DODMA and DODAP. Luciferase expression and cell viability are shown across mRNA doses; the particle-size and encapsulation measurements refer to the same study formulations. HEK293 cells; FLuc mRNA; N/P 4; 25–200 ng mRNA; 24-hour cell assessment; mean ± SD, n=3.
Carrasco et al. (2021), Communications Biology, Figure 3. CC BY 4.0. Original figure unchanged. Original article / figure · CC BY 4.0. Unmodified complete original figure; displayed at responsive size.
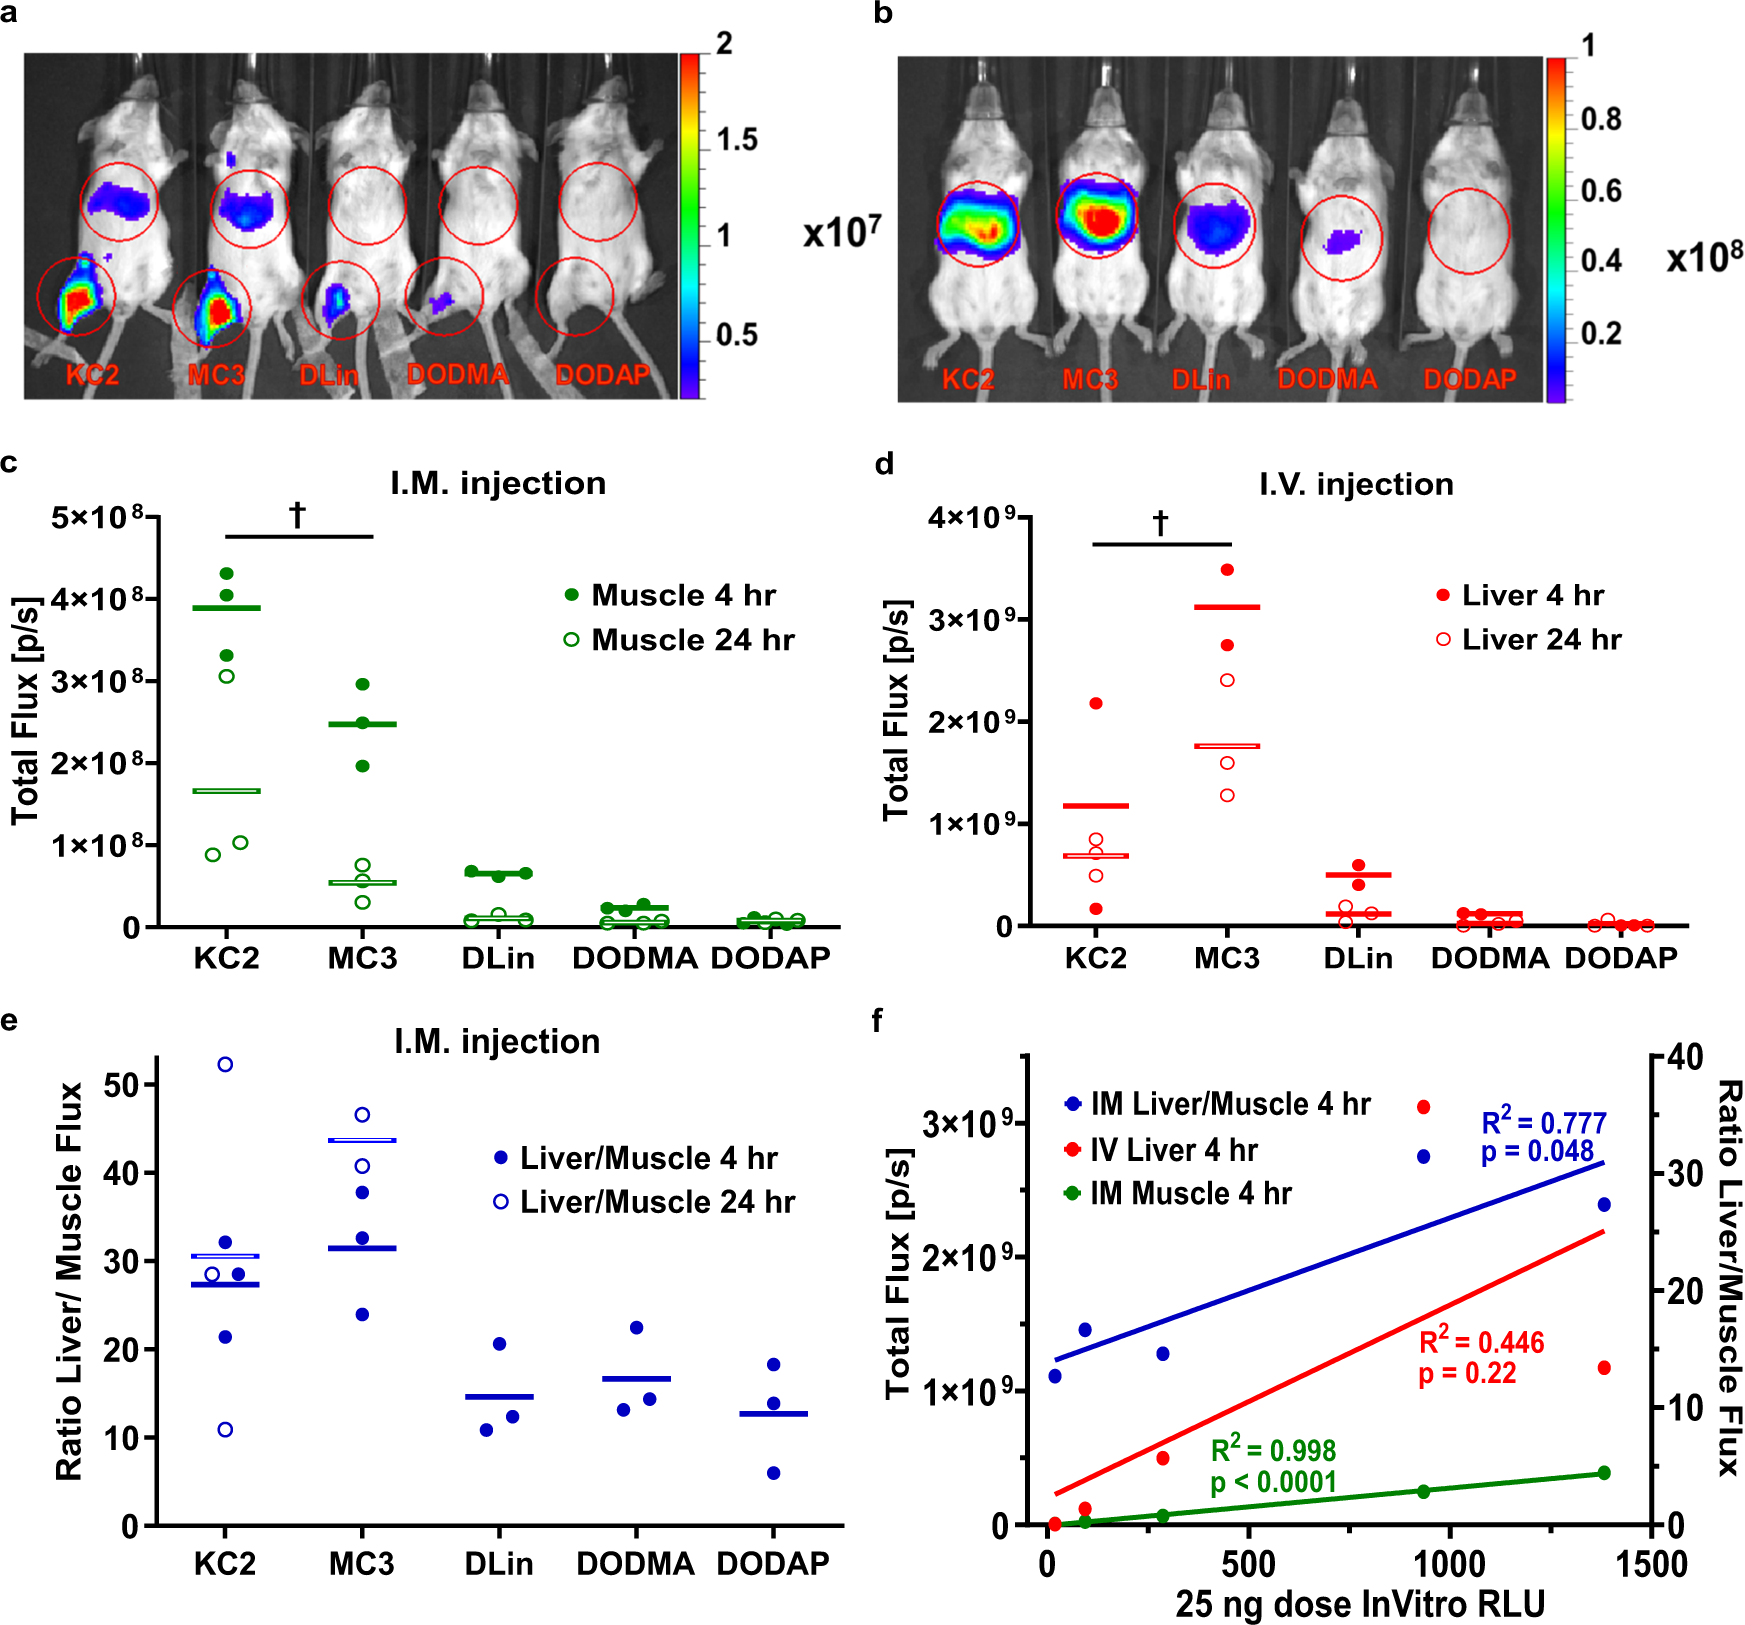
Figure 4 — Route-dependent reporter expression in mice
DLinDMA (DLin), MC3, DODMA and DODAP are individually labelled alongside KC2. The relative performance changes between intramuscular and intravenous administration; results should be read within the route and time point shown. 5 µg FLuc mRNA per mouse; N/P 4; IM or IV; measurements at 4 and 24 hours.
Carrasco et al. (2021), Communications Biology, Figure 4. CC BY 4.0. Original figure unchanged. Original article / figure · CC BY 4.0. Unmodified complete original figure; displayed at responsive size.
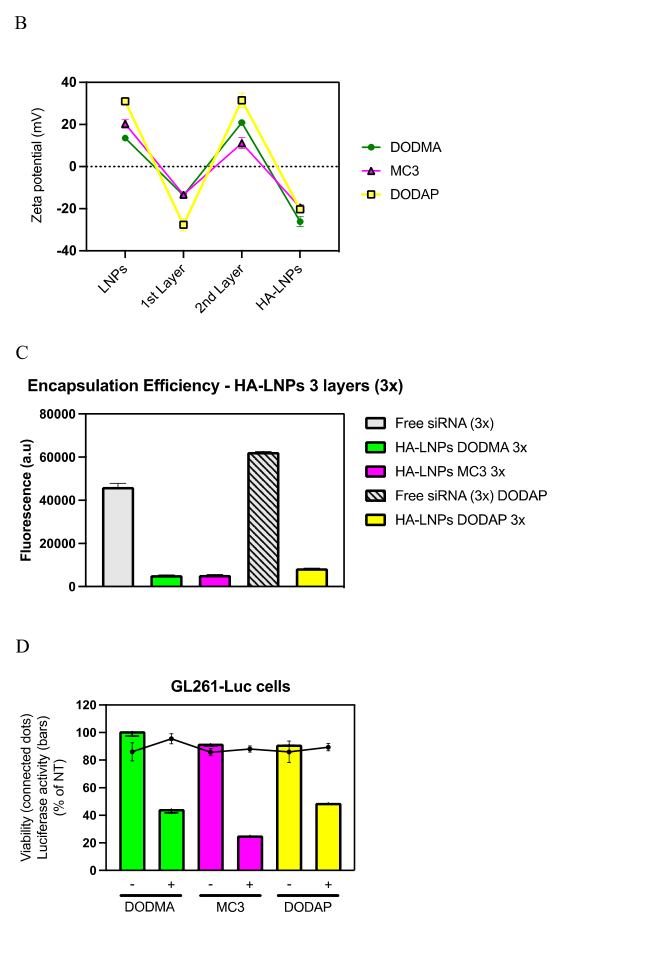
Figure 1B-D — Original panels compare DODMA-, MC3- and DODAP-based hyaluronan-decorated LNPs
Original panels compare DODMA-, MC3- and DODAP-based hyaluronan-decorated LNPs. Zeta potential, encapsulation-assay fluorescence and luciferase silencing are shown with their original controls. GL261-Luc cells; 180 nM siRNA; 48 h. Bars show luciferase activity and connected points show viability, normalized to untreated cells.
Passos Gibson V et al. (2024). Layered LNP properties and cell silencing. Original article / figure · CC BY 4.0. Panels B-D cropped from the publisher PDF, page 5; panel A omitted. Original axes, labels, controls and statistics retained.
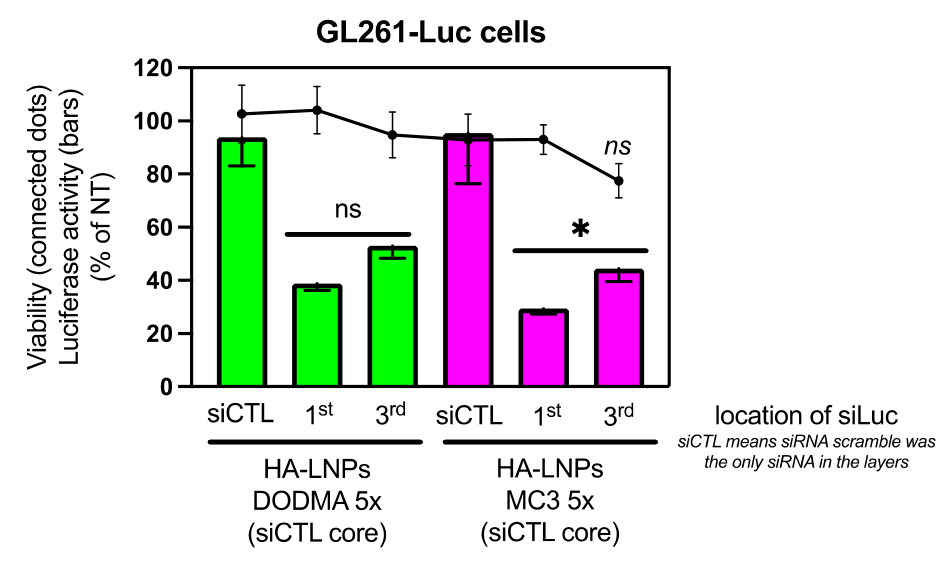
Figure 5 — Original figure compares DODMA and MC3 formulations with luciferase-directed siRNA placed in different polyelectrolyte layers
Original figure compares DODMA and MC3 formulations with luciferase-directed siRNA placed in different polyelectrolyte layers. The effect of layer placement is specific to this HA-LNP system. GL261-Luc cells; 180 nM siRNA; 48 h. Scrambled siRNA in the core; first- versus third-layer siLuc placement.
Passos Gibson V et al. (2024). Cell silencing with five-layer HA-LNPs. Original article / figure · CC BY 4.0. Complete figure extracted from publisher PDF, page 8; surrounding article text omitted; plotted content unchanged.