EEE4 · DCL0036

Literature tables

Cell performance

SSO and cell-tolerance assays

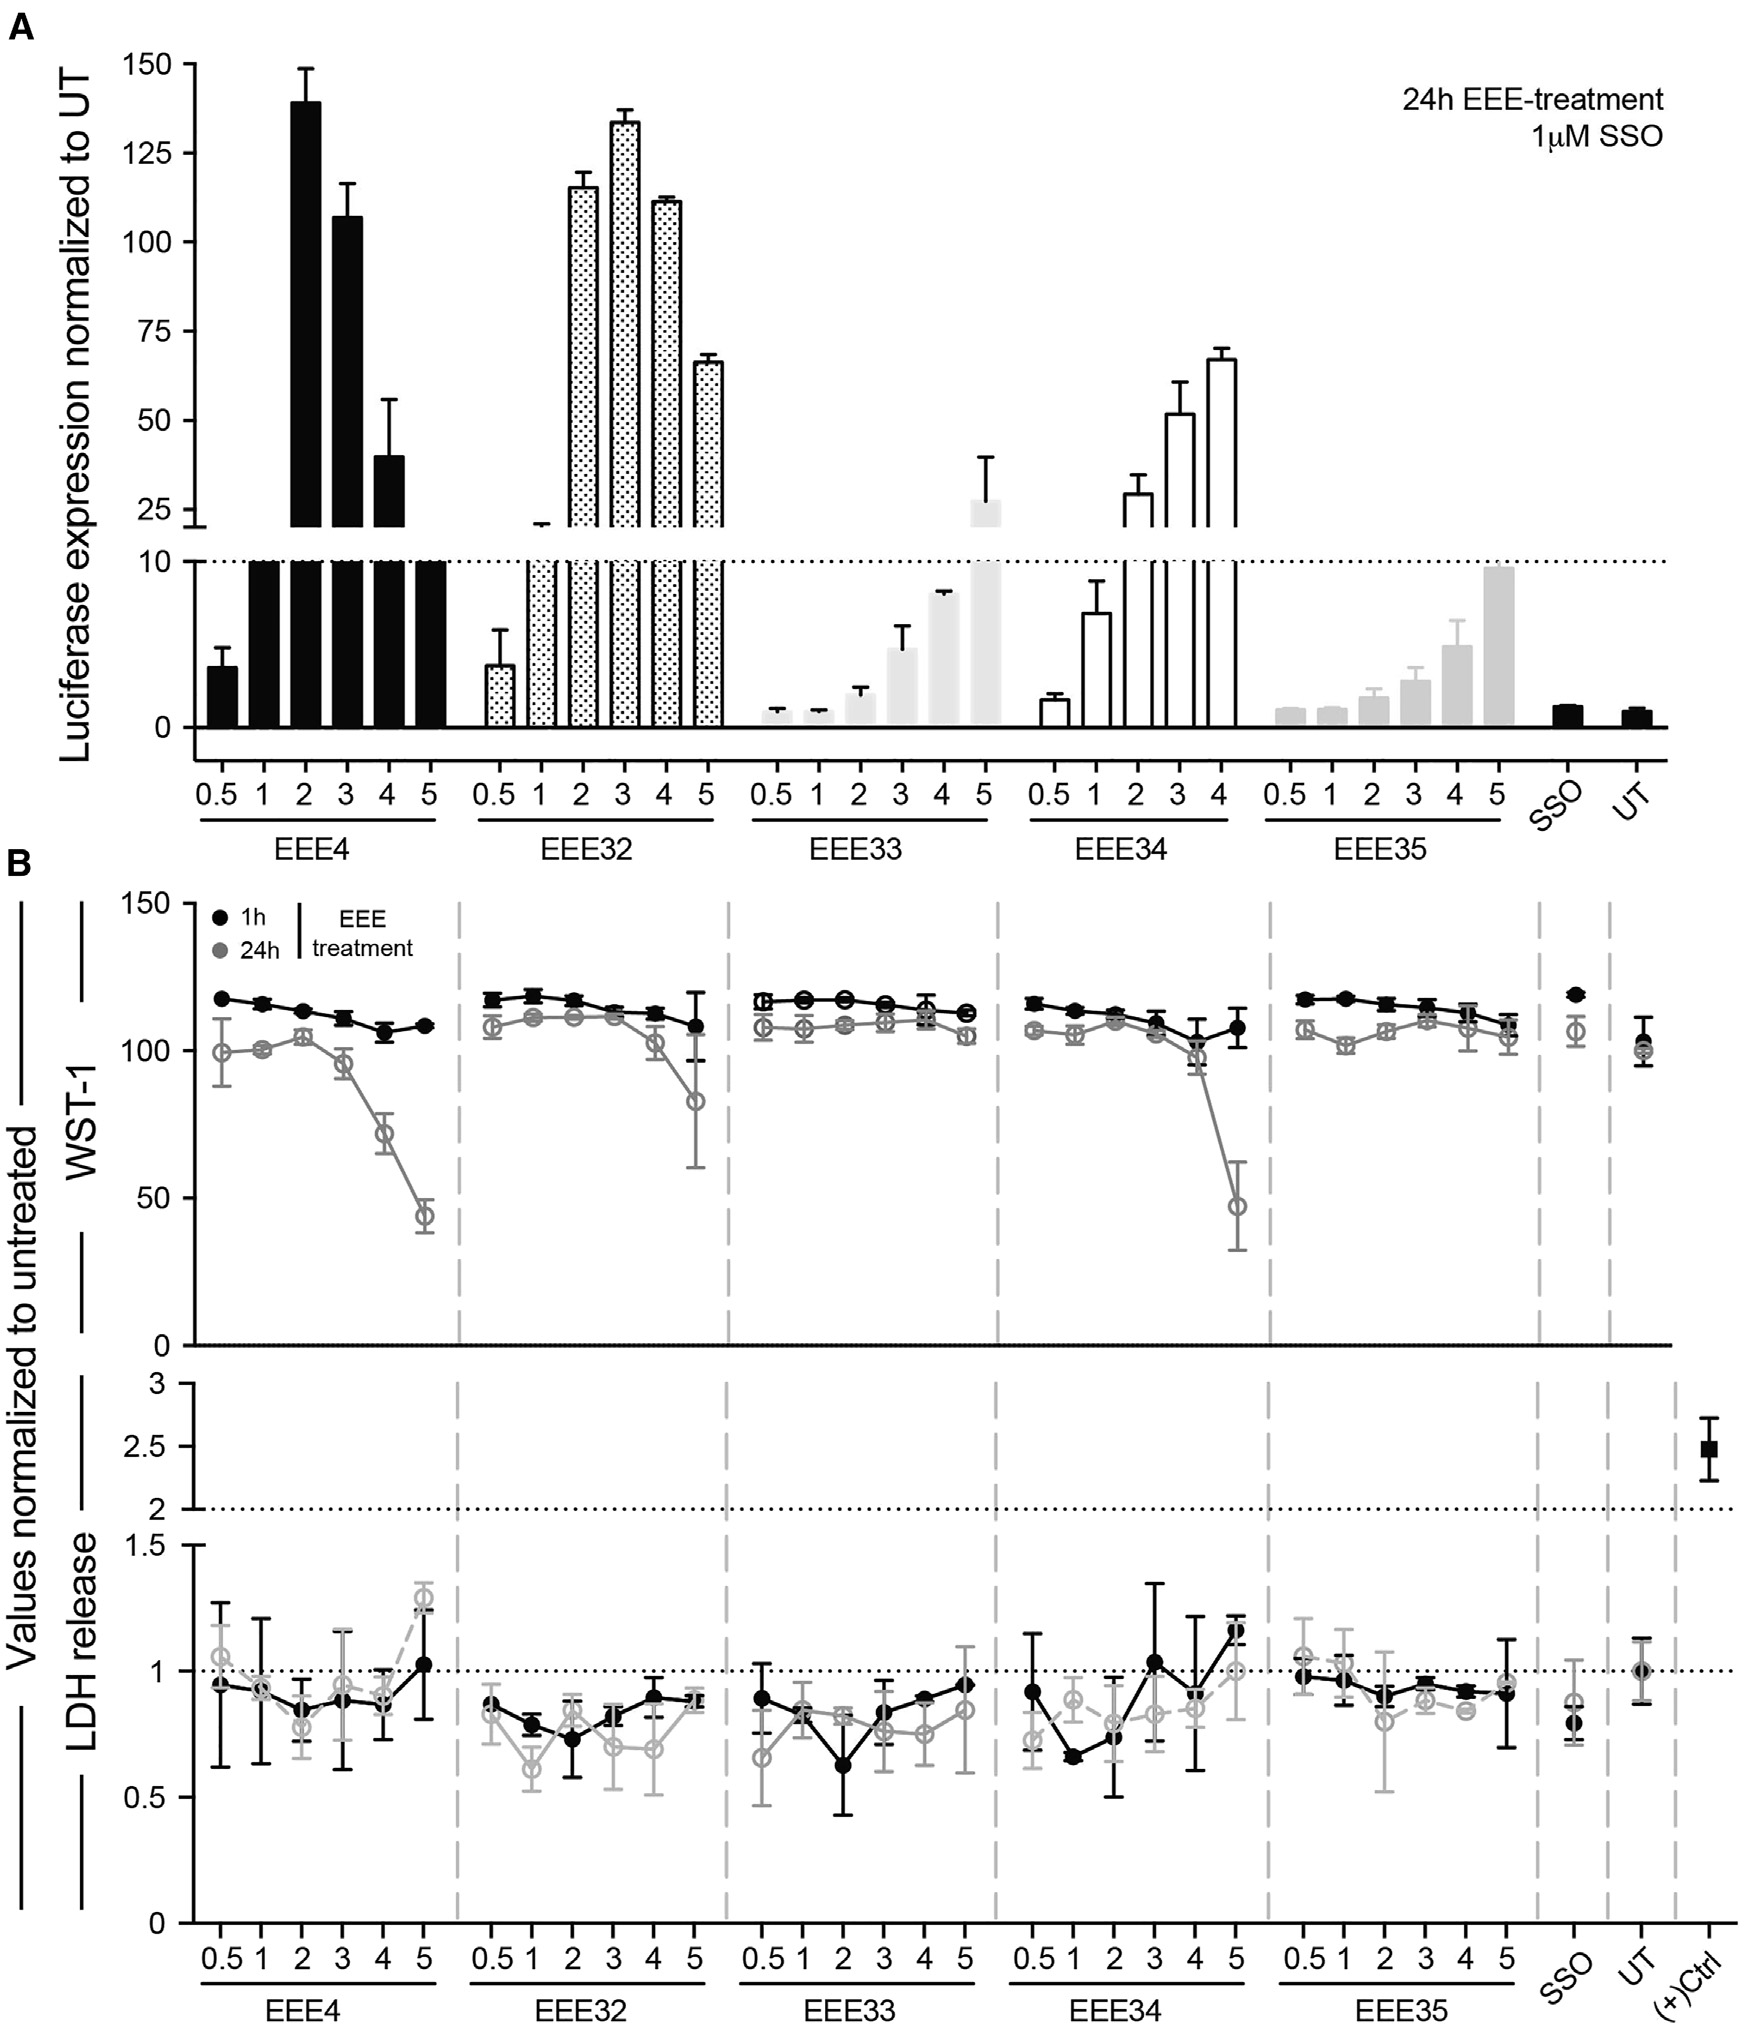
EEE4 enhanced SSO-mediated splice-correction luciferase activity in HeLa_Luc705 cells. Figure 3A: 1 µM SSO, EEE concentration series, 24-h EEE exposure.

WST-1/LDH responses depended on dose and exposure time. These assays do not establish general safety.

Figure 3A and corresponding Results/Methods · Estupiñán et al., 2025 · DOI: 10.1016/j.omtn.2025.102522

Primary hepatocyte siRNA assay

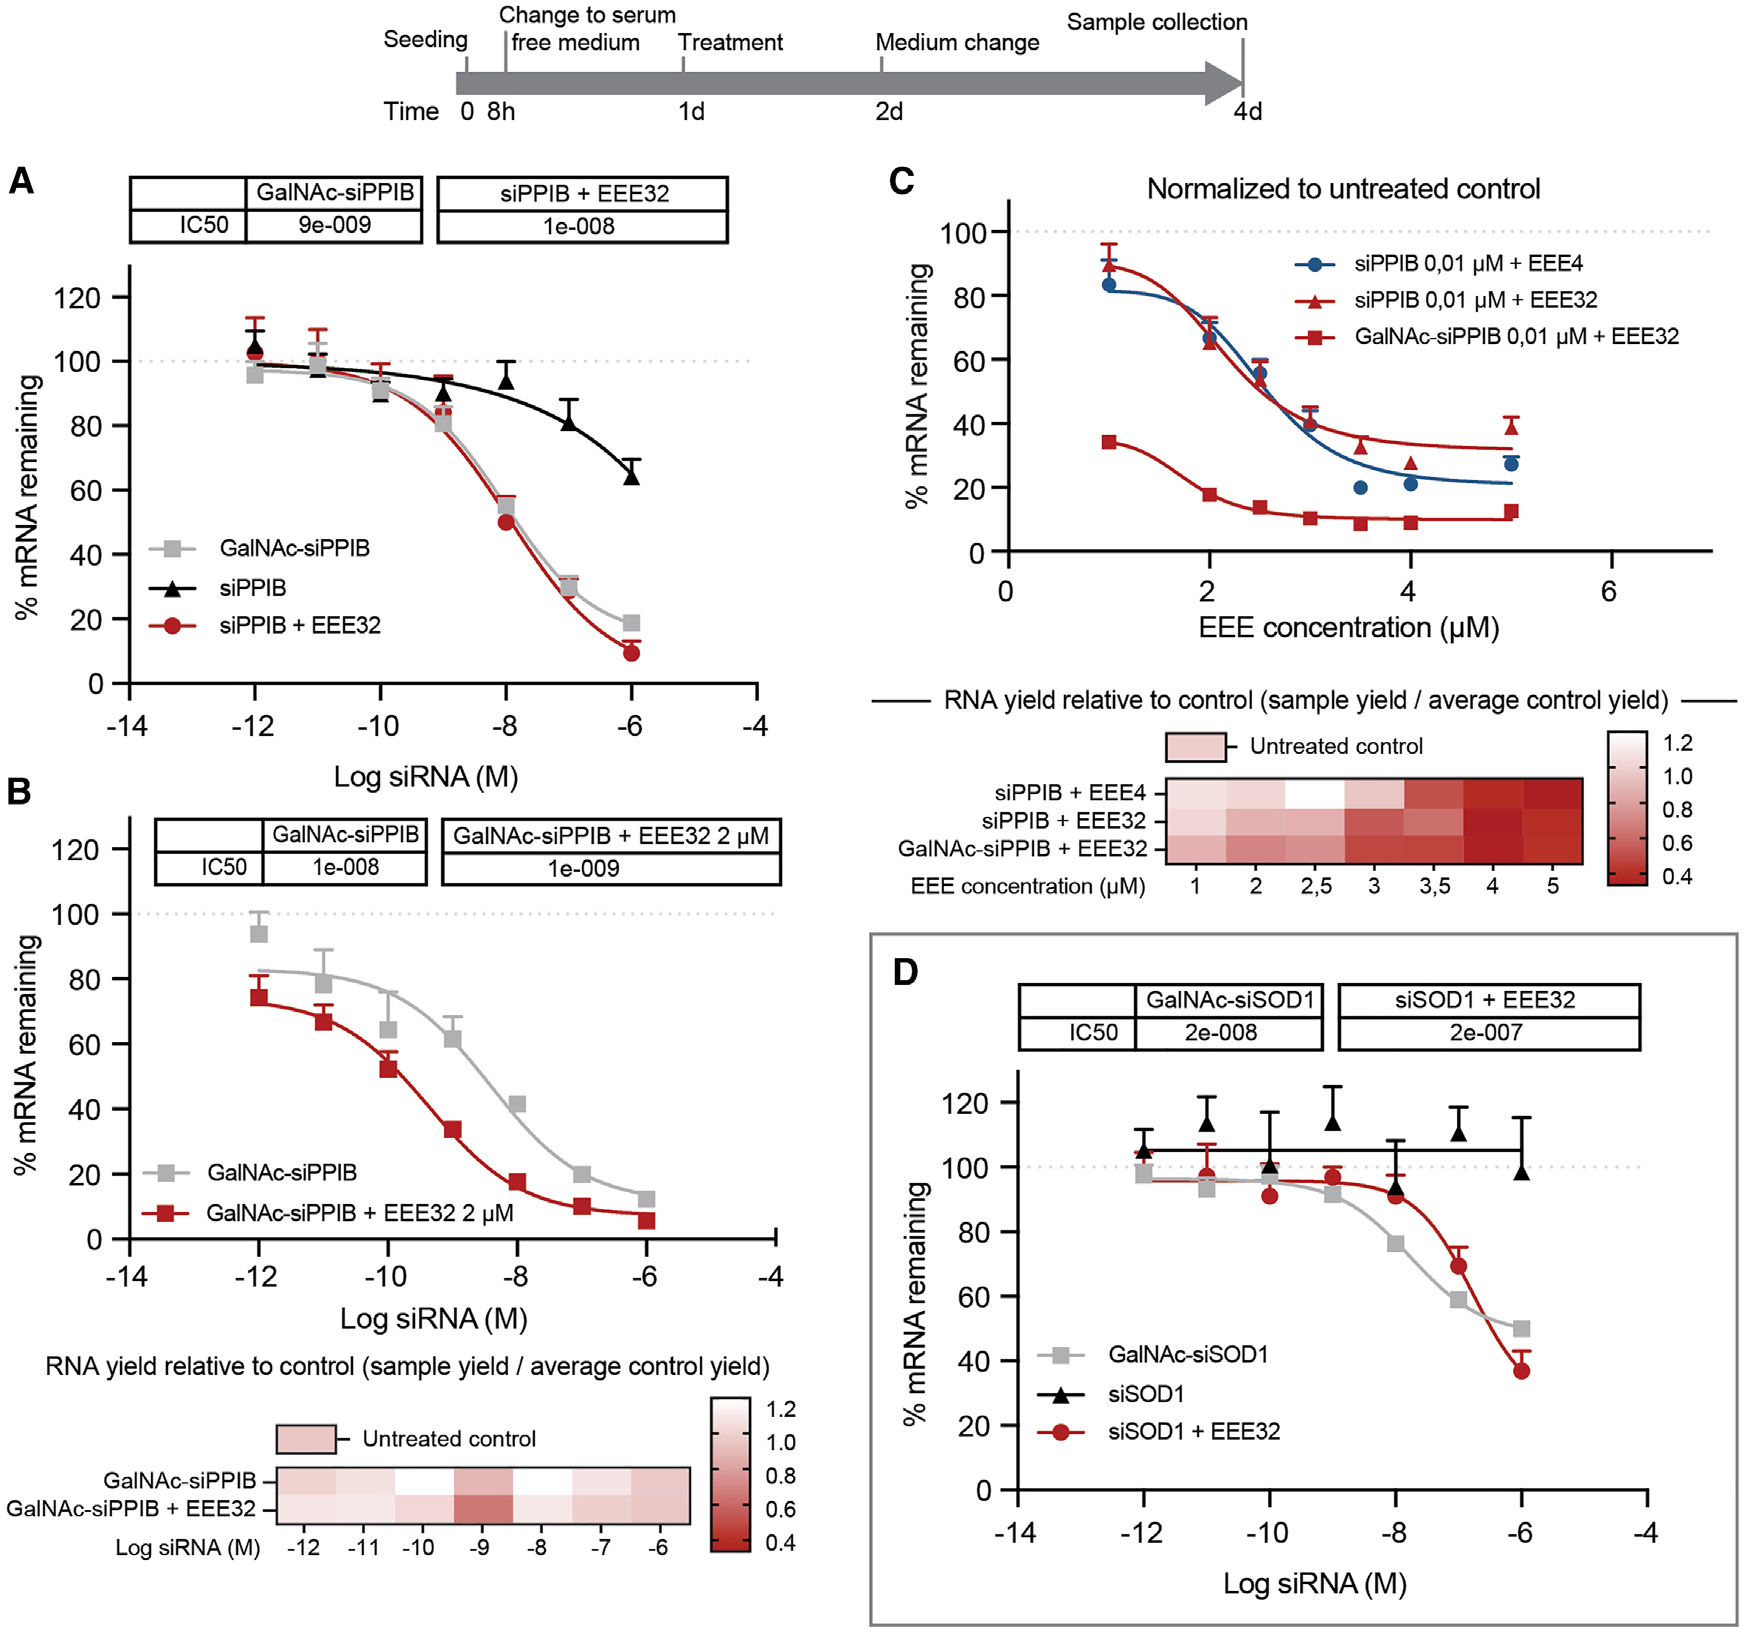
Primary human hepatocytes, Figure 5C: EEE4 and EEE32 showed similar PPIB knockdown with 10 nM siPPIB and an EEE concentration series (1, 2, 2.5, 3, 3.5, 4, 5 µM). EEE concentrations ≥3 µM reduced measured RNA yield.

siRNA sampling: Methods specify harvest 72 h after treatment start; the Figure 5 caption states 48 h. Both source statements are retained.

Figure 5C and corresponding Results · Estupiñán et al., 2025 · DOI: 10.1016/j.omtn.2025.102522

DC Chemicals supplies the compound only. Literature results apply to the cited cells, cargo and experimental conditions and do not guarantee performance in another experiment or delivery system.
Animal performance

No animal administration experiment or animal protocol for these compounds was reported in the examined paper and supporting information.

Entire main paper and supporting information · Estupiñán et al., 2025 · DOI: 10.1016/j.omtn.2025.102522

Original literature performance figures

Original Figure 3: A, SSO reporter activity; B, WST-1/LDH at 1 and 24 h. EEE4 and EEE32 groups are labelled; the other analogues remain as comparators. Bars: mean and SD.
Original Figure 3: A, SSO reporter activity; B, WST-1/LDH at 1 and 24 h. EEE4 and EEE32 groups are labelled; the other analogues remain as comparators. Bars: mean and SD. Estupiñán et al., 2025. CC BY 4.0. Original data, axes and statistical marks retained.
Open full-size original figure

Figure 3; article PDF page 6 · Estupiñán et al., 2025 · DOI: 10.1016/j.omtn.2025.102522

Original Figure 5: primary human hepatocyte siRNA experiments. EEE32 evidence is in A-D; EEE4 comparison is in C. RNA-yield heatmap: average of three replicates. Bars: mean and SD. Sampling-time qualification is given above.
Original Figure 5: primary human hepatocyte siRNA experiments. EEE32 evidence is in A-D; EEE4 comparison is in C. RNA-yield heatmap: average of three replicates. Bars: mean and SD. Sampling-time qualification is given above. Estupiñán et al., 2025. CC BY 4.0. Original data, axes and statistical marks retained.
Open full-size original figure

Figure 5; article PDF page 8 · Estupiñán et al., 2025 · DOI: 10.1016/j.omtn.2025.102522