LQ089 · DCL0031Published LQ089 formulation, expression and tolerability studies
Published LQ089 formulation, expression and tolerability studies
The article and its Supplementary Information report separate IV screening, IV/IM organ studies, storage and acute-toxicity experiments. Their doses, timepoints and cohorts are kept separate.
Research use only. DC Chemicals supplies the lipid only; literature LNP performance depends on the complete formulation and experimental conditions and is not guaranteed.
Wang et al.2024; main17pages and SI77pages · Wang et al., Nature Communications 15, 10804 (2024)
Formulation components and molecular-weight conversion
LQ089 : DSPC : Cholesterol : DMG-PEG2000 = 50 : 10 : 38.5 : 1.5
Total lipid concentration in the mixed ethanolic phase: 12.5 mM. The concentration after aqueous mixing is not specified. N/P is 6:1; the nitrogen/phosphate counting convention is not stated.
Main Methods,p14; SI Table 9, PDF p. 10 · Wang et al., Nature Communications 15, 10804 (2024)
Preparation and characterization
SI Table9 reports mean±SD,n=3 for particle characterization. No numerical SD is given for EE or pKa.
Individual lipid-stock concentrations,RNA input concentration,citrate-buffer strength/pH,injection volume and final administration concentration are not supplied.
Main PDF pp. 14–15; SI Table 9, PDF p. 10 · Wang et al., Nature Communications 15, 10804 (2024)
Cell experiment protocol
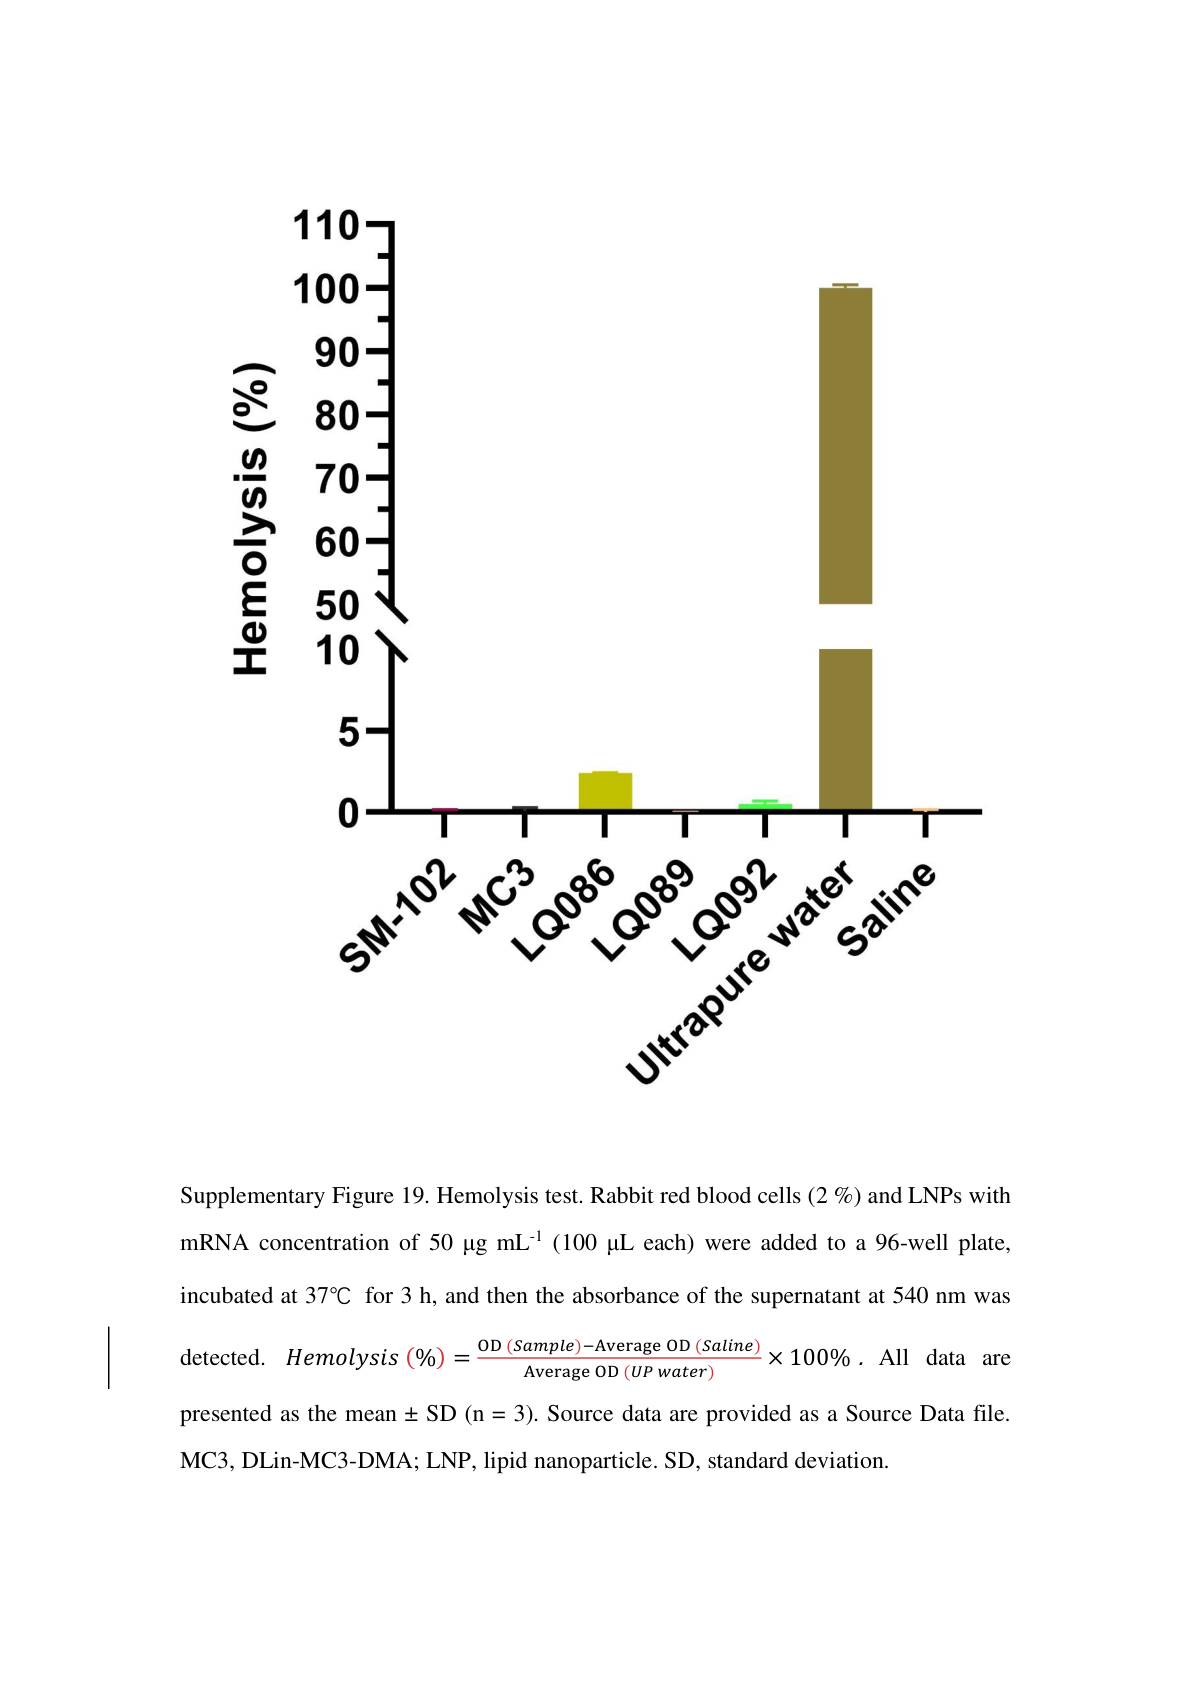
Rabbit erythrocyte hemolysis is reported. The article/SI does not report a separate LQ089 cellular mRNA-transfection or cell-viability experiment.
SI Fig.19,p30 · Wang et al., Supplementary Information
Fig.S19
- Dissolve individual lipids in ethanol; combine at50:10:38.5:1.5 with12.5mM total lipid in the mixed ethanolic phase.
- Prepare mRNA in acidic citrate. Mix at N/P6:1 using PNI microfluidics,reported flow12mL/min and aqueous:ethanol3:1v/v.
- Dialyze12–24h into0.01M PBS;concentrate with Amicon-Ultra10kDa MWCO and filter through0.22µm.
- Model: Rabbit erythrocytes; Route: In vitro / ex vivo; Dose / basis: 100 µL LNP (50 µg/mL mRNA) + 100 µL RBC (2%)
- Mix the stated RBC/LNP aliquots,incubate37°C3h and read supernatantA540. Separation settings are not given. Source formula:hemolysis%=(ODsample−meanODsaline)/meanODultrapurewater×100%.
Lipid stock
Ethanol;individual concentrations not reported
Ethanol
RNA aqueous phase
Acidic citrate;strength,pH and RNA concentration not reported
Acidic citrate;strength,pH and RNA concentration not reported
Mixed ethanolic phase
Total lipid concentration in the mixed ethanolic phase: 12.5 mM. The concentration after aqueous mixing is not specified. N/P is 6:1; the nitrogen/phosphate counting convention is not stated.
12.5 mM · Mixed ethanolic phase
Final administration / assay
Rabbit-RBC hemolysis was reported negative. Mix100µL2%RBC suspension with100µL LNP at50µg/mL mRNA;37°C for3h;supernatant absorbance540nm;n=3,mean±SD. Calculated final conditions:1%RBC and25µg/mL mRNA. Saline and ultrapure water are controls.
50 µg/mL mRNA · 100 µL LNP
Storage / use
Holding/storage for this specific experiment not separately stated
Main PDF p. 9; SI Fig.19,p30 · Wang et al., Supplementary Information
Animal experiment protocol
Individual lipid-stock concentrations,RNA input concentration,citrate-buffer strength/pH,injection volume and final administration concentration are not supplied.
Main PDF pp. 14–15; Figs4,6–10 · Wang et al., Nature Communications 15, 10804 (2024)
Main Methods, PDF p. 15 · Wang et al., Nature Communications 15, 10804 (2024)
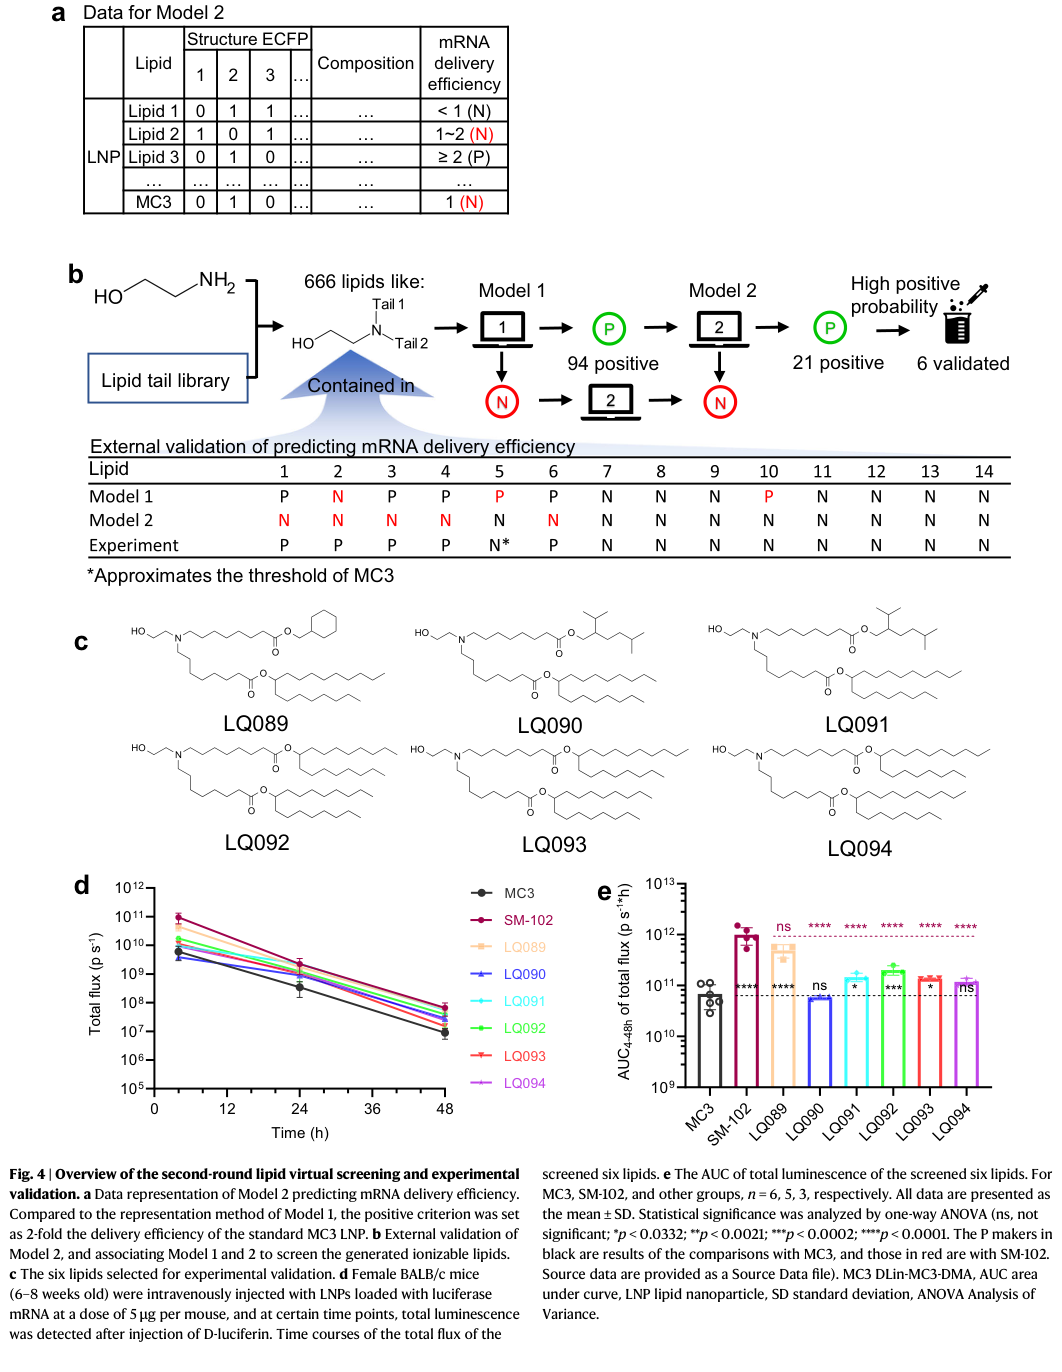
Fig.4
- Dissolve individual lipids in ethanol; combine at50:10:38.5:1.5 with12.5mM total lipid in the mixed ethanolic phase.
- Prepare mRNA in acidic citrate. Mix at N/P6:1 using PNI microfluidics,reported flow12mL/min and aqueous:ethanol3:1v/v.
- Dialyze12–24h into0.01M PBS;concentrate with Amicon-Ultra10kDa MWCO and filter through0.22µm.
- Model: Female BALB/c,6–8weeks; Route: IV; Dose / basis: 5 µg mRNA / mouse
- At4,24,48h give D-luciferin potassium IP(dose not separately stated for screening),measure whole-body IVIS Spectrum flux and evaluate AUC4–48h; log-transformed flux,one-wayANOVA,Bonferroni,α=.05.
Lipid stock
Ethanol;individual concentrations not reported
Ethanol
RNA aqueous phase
Acidic citrate;strength,pH and RNA concentration not reported
Acidic citrate;strength,pH and RNA concentration not reported
Mixed ethanolic phase
Total lipid concentration in the mixed ethanolic phase: 12.5 mM. The concentration after aqueous mixing is not specified. N/P is 6:1; the nitrogen/phosphate counting convention is not stated.
12.5 mM · Mixed ethanolic phase
Final administration / assay
5 µg mRNA / mouse; Injection volume and final concentration not reported
5 µg mRNA / mouse
Storage / use
Holding/storage for this specific experiment not separately stated
Resultspp5–6,Fig.4d–e; Methods, PDF p. 15 · Wang et al., Nature Communications 15, 10804 (2024)
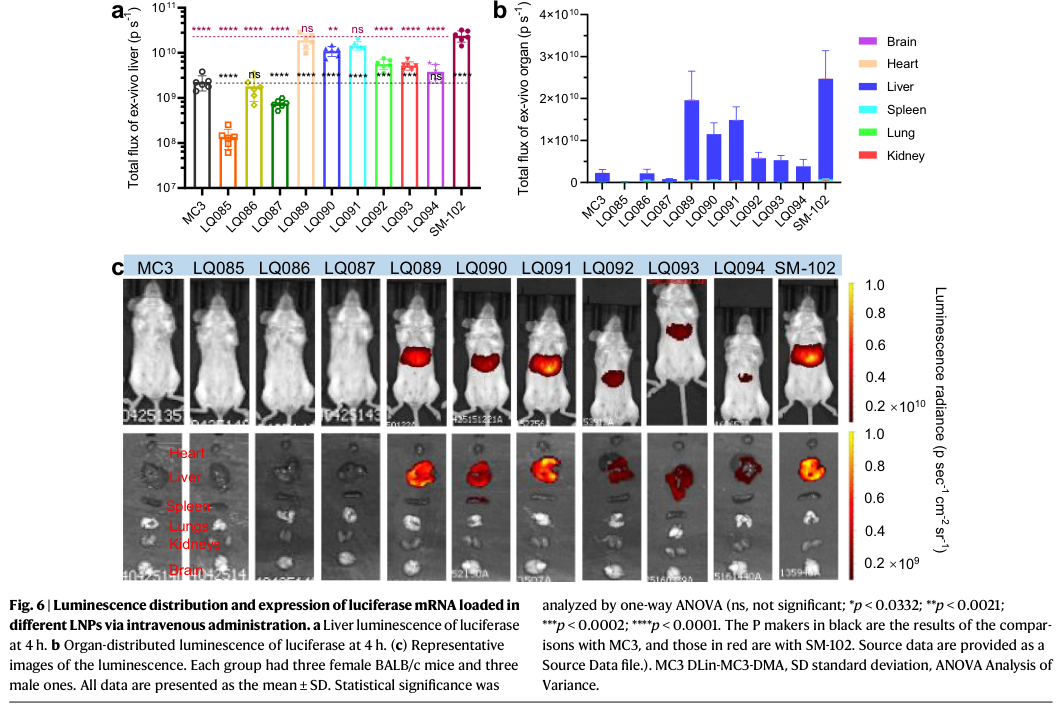
Fig.6
- Dissolve individual lipids in ethanol; combine at50:10:38.5:1.5 with12.5mM total lipid in the mixed ethanolic phase.
- Prepare mRNA in acidic citrate. Mix at N/P6:1 using PNI microfluidics,reported flow12mL/min and aqueous:ethanol3:1v/v.
- Dialyze12–24h into0.01M PBS;concentrate with Amicon-Ultra10kDa MWCO and filter through0.22µm.
- Model: BALB/c,3female+3male/group; Route: IV; Dose / basis: 5 µg mRNA / mouse
- At4h give D-luciferin potassium IP3mg/mouse,record whole-body IVIS,then isolate heart,liver,spleen,lungs,kidneys,brain for ex vivo bioluminescence.
Lipid stock
Ethanol;individual concentrations not reported
Ethanol
RNA aqueous phase
Acidic citrate;strength,pH and RNA concentration not reported
Acidic citrate;strength,pH and RNA concentration not reported
Mixed ethanolic phase
Total lipid concentration in the mixed ethanolic phase: 12.5 mM. The concentration after aqueous mixing is not specified. N/P is 6:1; the nitrogen/phosphate counting convention is not stated.
12.5 mM · Mixed ethanolic phase
Final administration / assay
5 µg mRNA / mouse; Injection volume and final concentration not reported
5 µg mRNA / mouse
Storage / use
Holding/storage for this specific experiment not separately stated
Main PDF pp. 7–8,Fig.6a–c; Methods, PDF p. 15 · Wang et al., Nature Communications 15, 10804 (2024)
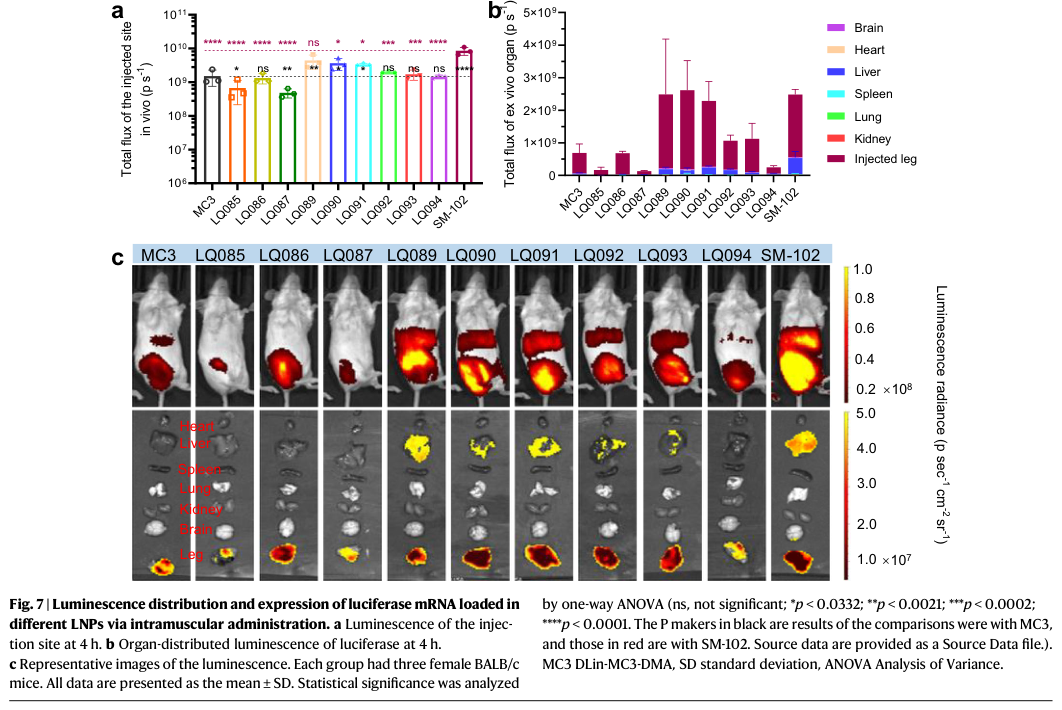
Fig.7
- Dissolve individual lipids in ethanol; combine at50:10:38.5:1.5 with12.5mM total lipid in the mixed ethanolic phase.
- Prepare mRNA in acidic citrate. Mix at N/P6:1 using PNI microfluidics,reported flow12mL/min and aqueous:ethanol3:1v/v.
- Dialyze12–24h into0.01M PBS;concentrate with Amicon-Ultra10kDa MWCO and filter through0.22µm.
- Model: BALB/c,3female+3male/group; Route: IM; Dose / basis: 5 µg mRNA / mouse
- At4h give D-luciferin potassium IP3mg/mouse,measure injection-site/whole-body signal and image isolated organs. Muscle site and injection volume are not specified.
Lipid stock
Ethanol;individual concentrations not reported
Ethanol
RNA aqueous phase
Acidic citrate;strength,pH and RNA concentration not reported
Acidic citrate;strength,pH and RNA concentration not reported
Mixed ethanolic phase
Total lipid concentration in the mixed ethanolic phase: 12.5 mM. The concentration after aqueous mixing is not specified. N/P is 6:1; the nitrogen/phosphate counting convention is not stated.
12.5 mM · Mixed ethanolic phase
Final administration / assay
5 µg mRNA / mouse; Injection volume and final concentration not reported
5 µg mRNA / mouse
Storage / use
Holding/storage for this specific experiment not separately stated
Main PDF pp. 8–9,Fig.7; Methods, PDF p. 15 · Wang et al., Nature Communications 15, 10804 (2024)
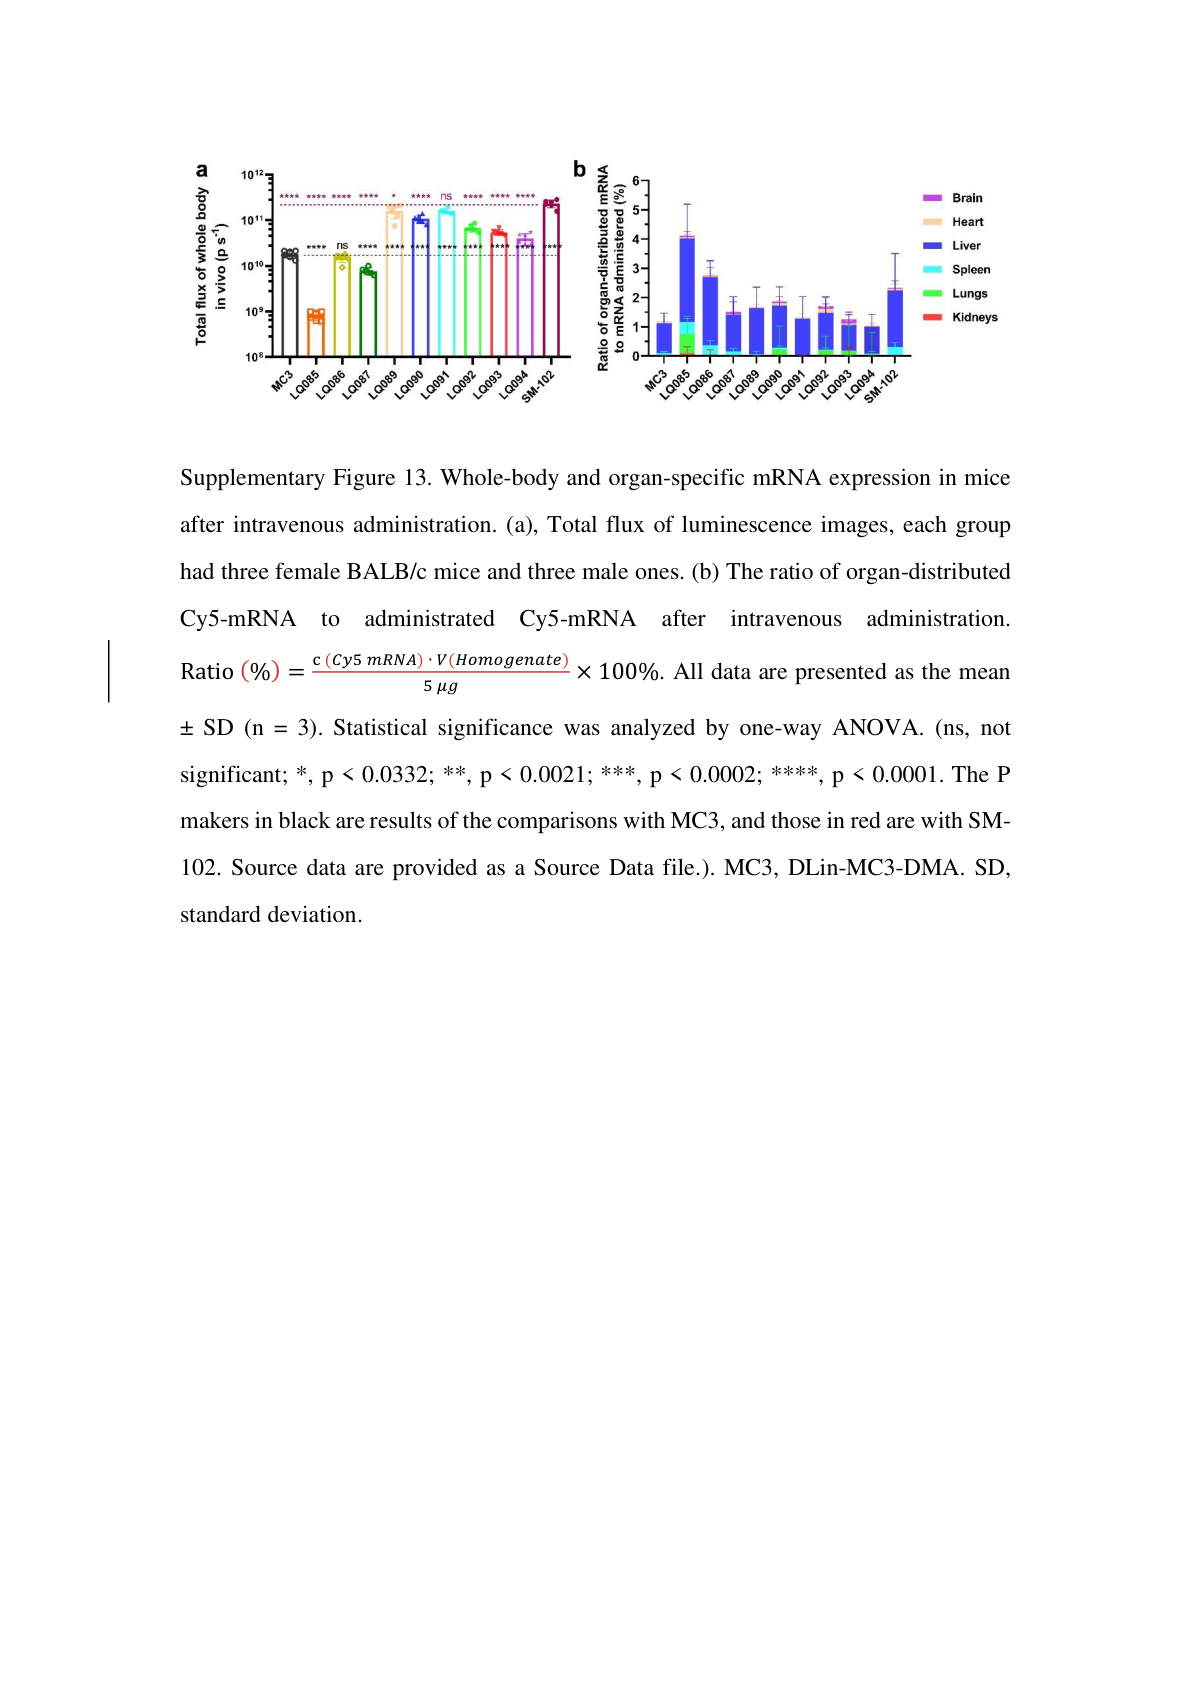
Fig.S13b
- Dissolve individual lipids in ethanol; combine at50:10:38.5:1.5 with12.5mM total lipid in the mixed ethanolic phase.
- Prepare mRNA in acidic citrate. Mix at N/P6:1 using PNI microfluidics,reported flow12mL/min and aqueous:ethanol3:1v/v.
- Dialyze12–24h into0.01M PBS;concentrate with Amicon-Ultra10kDa MWCO and filter through0.22µm.
- Model: BALB/c;n=3;cohort sex not separately stated; Route: IV; Dose / basis: 5 µg Cy5-mRNA / mouse
- At4h prepare20%organ homogenates inPBS on ice,centrifuge and measure supernatant atEx650/Em670nm. Use organ-matched Cy5-mRNA standard curves and divide recovered amount by5µg. Centrifugation settings and20%basis are not defined.
Lipid stock
Ethanol;individual concentrations not reported
Ethanol
RNA aqueous phase
Acidic citrate;strength,pH and RNA concentration not reported
Acidic citrate;strength,pH and RNA concentration not reported
Mixed ethanolic phase
Total lipid concentration in the mixed ethanolic phase: 12.5 mM. The concentration after aqueous mixing is not specified. N/P is 6:1; the nitrogen/phosphate counting convention is not stated.
12.5 mM · Mixed ethanolic phase
Final administration / assay
5 µg Cy5-mRNA / mouse; Injection volume and final concentration not reported
5 µg Cy5-mRNA / mouse
Storage / use
Holding/storage for this specific experiment not separately stated
Main PDF pp. 7–8; Methods, PDF p. 15; SI Fig.13b,p24 · Wang et al., Nature Communications 15, 10804 (2024)
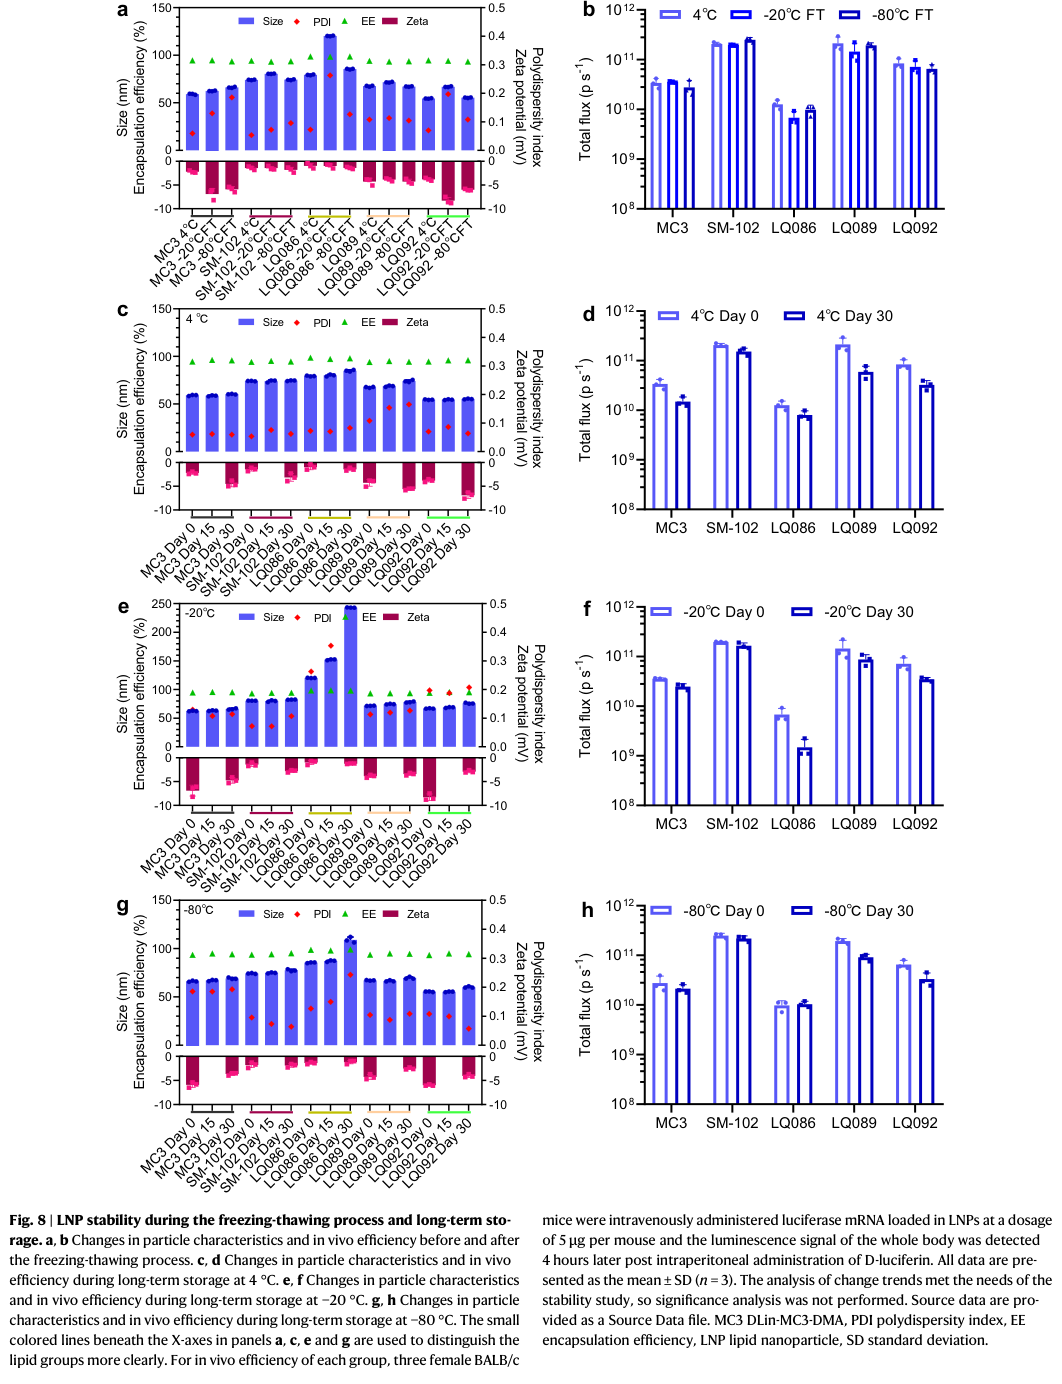
Fig.8
- Dissolve individual lipids in ethanol; combine at50:10:38.5:1.5 with12.5mM total lipid in the mixed ethanolic phase.
- Prepare mRNA in acidic citrate. Mix at N/P6:1 using PNI microfluidics,reported flow12mL/min and aqueous:ethanol3:1v/v.
- Dialyze12–24h into0.01M PBS;concentrate with Amicon-Ultra10kDa MWCO and filter through0.22µm.
- Model: Female BALB/c,6–8weeks; Route: IV; Dose / basis: 5 µg mRNA / mouse
- Freeze at−20/−80°C and thaw at room temperature;cycle count not stated. Store at4/−20/−80°C,interimDay14(text)/15(axes),terminalDay30. Assess size/PDI/EE,zeta and IV expression(n=3,5µg/mouse,4h).
Lipid stock
Ethanol;individual concentrations not reported
Ethanol
RNA aqueous phase
Acidic citrate;strength,pH and RNA concentration not reported
Acidic citrate;strength,pH and RNA concentration not reported
Mixed ethanolic phase
Total lipid concentration in the mixed ethanolic phase: 12.5 mM. The concentration after aqueous mixing is not specified. N/P is 6:1; the nitrogen/phosphate counting convention is not stated.
12.5 mM · Mixed ethanolic phase
Final administration / assay
5 µg mRNA / mouse; Injection volume and final concentration not reported
5 µg mRNA / mouse
Storage / use
LQ089 LNP particle properties remained acceptable during30days at4°C,−20°C and−80°C,while in vivo expression decreased. Freeze/thaw modestly affected expression. Interim sampling is Day14 in text but Day15 on Fig.8axes; cycle count is not stated. These results do not set neat-lipid shelf life.
Formulated LQ089 LNPs at4°C,−20°C,−80°C; thaw at room temperature. Interim Day14(text)/Day15(axes); terminal Day30. Cycle count and holding times not given.
Main PDF p. 8; Fig.8a–h,p10 · Wang et al., Nature Communications 15, 10804 (2024)
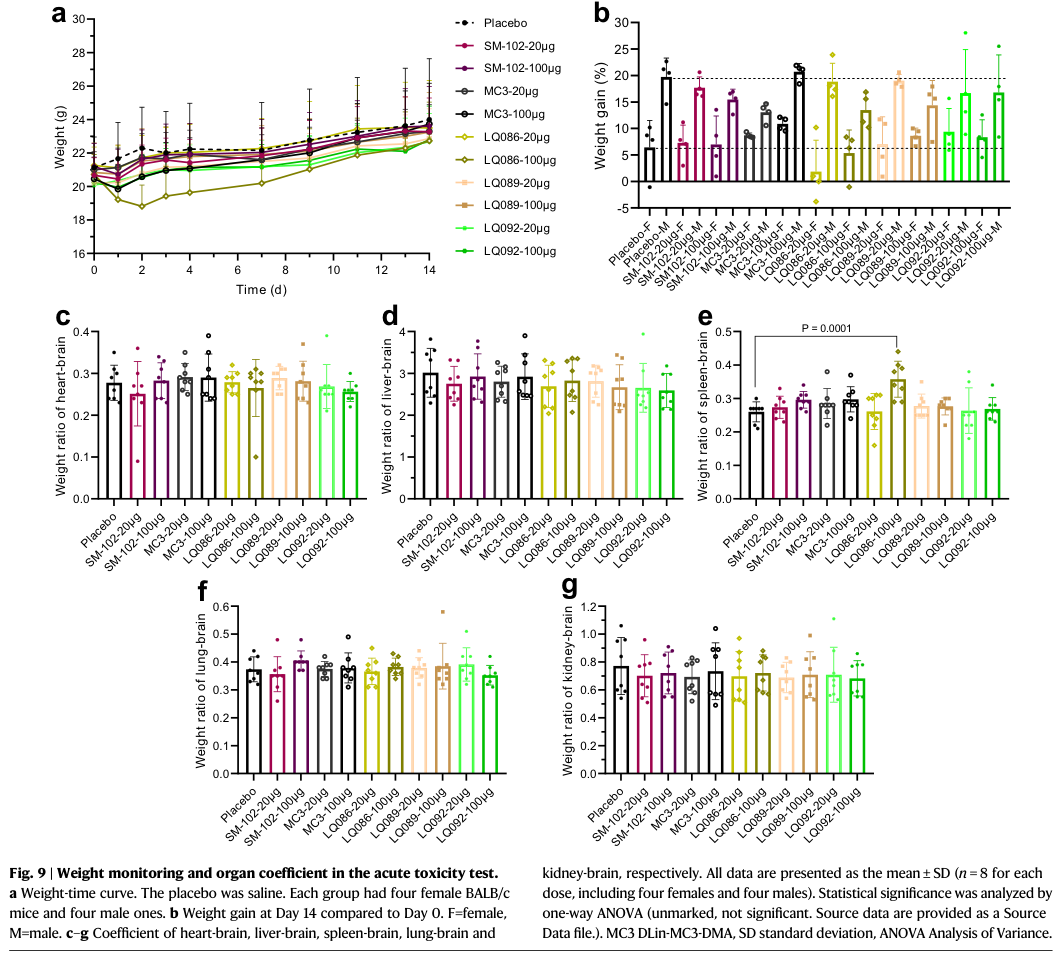
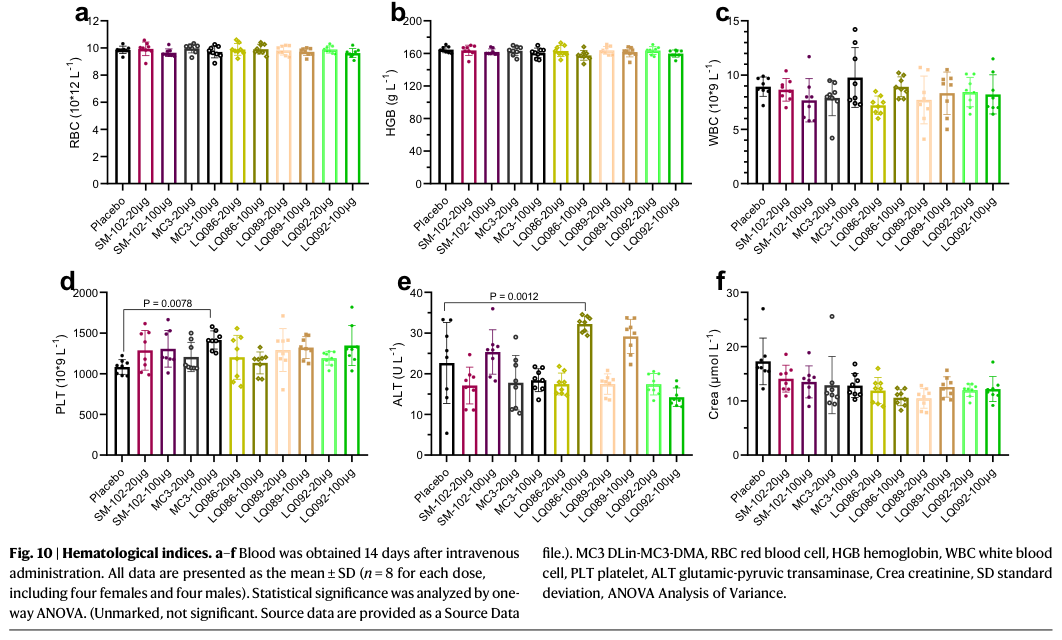
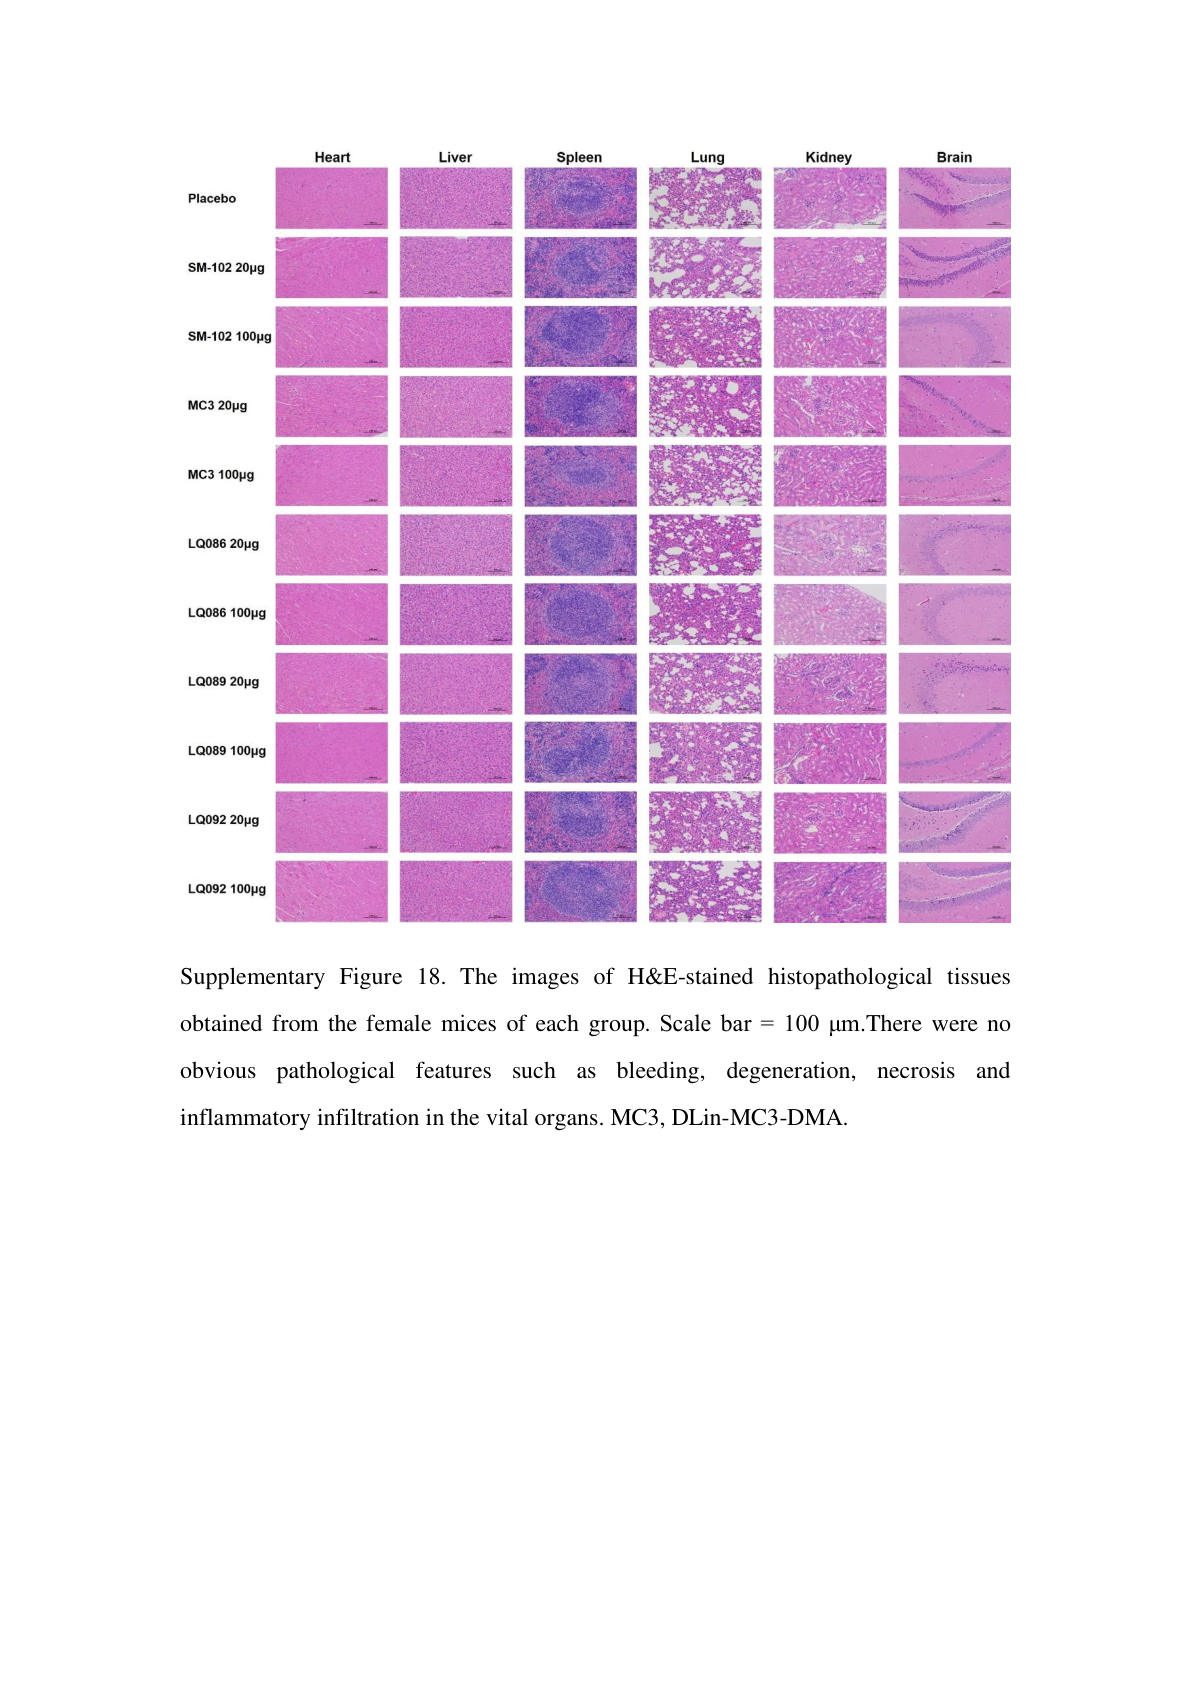
Figs.9–10,S18
- Dissolve individual lipids in ethanol; combine at50:10:38.5:1.5 with12.5mM total lipid in the mixed ethanolic phase.
- Prepare mRNA in acidic citrate. Mix at N/P6:1 using PNI microfluidics,reported flow12mL/min and aqueous:ethanol3:1v/v.
- Dialyze12–24h into0.01M PBS;concentrate with Amicon-Ultra10kDa MWCO and filter through0.22µm.
- Model: BALB/c,4female+4male/dose; Route: IV; Dose / basis: 20 / 100 µg mRNA / mouse (1 / 5 mg/kg)
- Monitor weight onDays1,2,3,4,7,9,11,13,14;collect blood/organs onDay14. HEMAVET blood cells and Rayto ALT/creatinine. Fix organs in4%buffered formalin3days,paraffin embed,cut5µm,dewax ethanol/xylene,H&E stain,3DHISTECH scan.
Lipid stock
Ethanol;individual concentrations not reported
Ethanol
RNA aqueous phase
Acidic citrate;strength,pH and RNA concentration not reported
Acidic citrate;strength,pH and RNA concentration not reported
Mixed ethanolic phase
Total lipid concentration in the mixed ethanolic phase: 12.5 mM. The concentration after aqueous mixing is not specified. N/P is 6:1; the nitrogen/phosphate counting convention is not stated.
12.5 mM · Mixed ethanolic phase
Final administration / assay
20 / 100 µg mRNA / mouse (1 / 5 mg/kg); Injection volume and final concentration not reported
20 / 100 µg mRNA / mouse (1 / 5 mg/kg)
Storage / use
Holding/storage for this specific experiment not separately stated
Main PDF pp. 8–9; Fig.9,p11; Fig.10,p13; Methods, PDF p. 15; SI Figs.16–18,pp27–29 · Wang et al., Nature Communications 15, 10804 (2024)
References
Wang W, Chen K, Jiang T, et al. Artificial intelligence-driven rational design of ionizable lipids for mRNA delivery. Nature Communications15,10804(2024). · Wang et al., Nature Communications 15, 10804 (2024)
SI§2.4,pp45–51; Table 9, PDF p. 10; Figs13,18,19 · Wang et al., Supplementary Information