Formulation & Performance
Formulation & In Vivo Data
Product-specific storage, solubility, purity, availability and lead time require confirmation. For research use only. DC Chemicals supplies the lipid only; literature LNP performance is not guaranteed.
pKa and N/P
The complete main article was unavailable. No pKa value, intrinsic/apparent/LNP-apparent type, measurement method or conditions were identified in the supplied SI or abstract. N/P, lipid:RNA mass ratio and their definitions also remain unavailable. No values are inferred.
Formulation components and molecular-weight conversion
SI Table S1 reports 16 screening formulations. Their correspondence to the optimized sW3 formulation and the individual cell and animal experiments is not established in the available sources. Reported molar-ratio coefficients are retained; calculations use their relative proportions.
DMG-PEG2000: 2507 g/mol (catalog average). Component masses below are calculated conversions.
W3-S1-F01 · 35.8:26.9:35.8:1.5
Component mass calculator · W3-S1-F01
Calculated mass conversions; editing inputs creates a research scenario.
| Component | MW (g/mol) | Reported molar ratio | mg | % |
|---|---|---|---|---|
| W3 | — | — | ||
| Cholesterol | — | — | ||
| DSPC | — | — | ||
| DMG-PEG2000 | — | — |
Not established from the available sources
W3-S1-F02 · 28.1:42.2:28.1:1.5
W3-S1-F02
Component mass calculator · W3-S1-F02
Calculated mass conversions; editing inputs creates a research scenario.
| Component | MW (g/mol) | Reported molar ratio | mg | % |
|---|---|---|---|---|
| W3 | — | — | ||
| Cholesterol | — | — | ||
| DSPC | — | — | ||
| DMG-PEG2000 | — | — |
Not established from the available sources
W3-S1-F03 · 32.8:49.2:16.4:1.5
W3-S1-F03
Component mass calculator · W3-S1-F03
Calculated mass conversions; editing inputs creates a research scenario.
| Component | MW (g/mol) | Reported molar ratio | mg | % |
|---|---|---|---|---|
| W3 | — | — | ||
| Cholesterol | — | — | ||
| DSPC | — | — | ||
| DMG-PEG2000 | — | — |
Not established from the available sources
W3-S1-F04 · 38.8:35.8:23.9:1.5
W3-S1-F04
Component mass calculator · W3-S1-F04
Calculated mass conversions; editing inputs creates a research scenario.
| Component | MW (g/mol) | Reported molar ratio | mg | % |
|---|---|---|---|---|
| W3 | — | — | ||
| Cholesterol | — | — | ||
| DSPC | — | — | ||
| DMG-PEG2000 | — | — |
Not established from the available sources
W3-S1-F05 · 43.8:32.8:21.9:1.5
W3-S1-F05
Component mass calculator · W3-S1-F05
Calculated mass conversions; editing inputs creates a research scenario.
| Component | MW (g/mol) | Reported molar ratio | mg | % |
|---|---|---|---|---|
| W3 | — | — | ||
| Cholesterol | — | — | ||
| DSPC | — | — | ||
| DMG-PEG2000 | — | — |
Not established from the available sources
W3-S1-F06 · 38.4:16.6:43.5:1.5
W3-S1-F06
Component mass calculator · W3-S1-F06
Calculated mass conversions; editing inputs creates a research scenario.
| Component | MW (g/mol) | Reported molar ratio | mg | % |
|---|---|---|---|---|
| W3 | — | — | ||
| Cholesterol | — | — | ||
| DSPC | — | — | ||
| DMG-PEG2000 | — | — |
Not established from the available sources
W3-S1-F07 · 47.4:43.7:7.4:1.5
W3-S1-F07
Component mass calculator · W3-S1-F07
Calculated mass conversions; editing inputs creates a research scenario.
| Component | MW (g/mol) | Reported molar ratio | mg | % |
|---|---|---|---|---|
| W3 | — | — | ||
| Cholesterol | — | — | ||
| DSPC | — | — | ||
| DMG-PEG2000 | — | — |
Not established from the available sources
W3-S1-F08 · 50:38.5:10:1.5
W3-S1-F08
Component mass calculator · W3-S1-F08
Calculated mass conversions; editing inputs creates a research scenario.
| Component | MW (g/mol) | Reported molar ratio | mg | % |
|---|---|---|---|---|
| W3 | — | — | ||
| Cholesterol | — | — | ||
| DSPC | — | — | ||
| DMG-PEG2000 | — | — |
Not established from the available sources
W3-S1-F09 · 56.3:42.2:0:1.5
W3-S1-F09
Component mass calculator · W3-S1-F09
Calculated mass conversions; editing inputs creates a research scenario.
| Component | MW (g/mol) | Reported molar ratio | mg | % |
|---|---|---|---|---|
| W3 | — | — | ||
| Cholesterol | — | — | ||
| DSPC | — | — | ||
| DMG-PEG2000 | — | — |
Not established from the available sources
W3-S1-F10 · 65.7:0:32.8:1.5
W3-S1-F10
Component mass calculator · W3-S1-F10
Calculated mass conversions; editing inputs creates a research scenario.
| Component | MW (g/mol) | Reported molar ratio | mg | % |
|---|---|---|---|---|
| W3 | — | — | ||
| Cholesterol | — | — | ||
| DSPC | — | — | ||
| DMG-PEG2000 | — | — |
Not established from the available sources
W3-S1-F11 · 32.9:56.1:9.5:1.5
W3-S1-F11
Component mass calculator · W3-S1-F11
Calculated mass conversions; editing inputs creates a research scenario.
| Component | MW (g/mol) | Reported molar ratio | mg | % |
|---|---|---|---|---|
| W3 | — | — | ||
| Cholesterol | — | — | ||
| DSPC | — | — | ||
| DMG-PEG2000 | — | — |
Not established from the available sources
W3-S1-F12 · 57.2:24.8:16.5:1.5
W3-S1-F12
Component mass calculator · W3-S1-F12
Calculated mass conversions; editing inputs creates a research scenario.
| Component | MW (g/mol) | Reported molar ratio | mg | % |
|---|---|---|---|---|
| W3 | — | — | ||
| Cholesterol | — | — | ||
| DSPC | — | — | ||
| DMG-PEG2000 | — | — |
Not established from the available sources
W3-S1-F13 · 25.7:43.7:29.1:1.5
W3-S1-F13
Component mass calculator · W3-S1-F13
Calculated mass conversions; editing inputs creates a research scenario.
| Component | MW (g/mol) | Reported molar ratio | mg | % |
|---|---|---|---|---|
| W3 | — | — | ||
| Cholesterol | — | — | ||
| DSPC | — | — | ||
| DMG-PEG2000 | — | — |
Not established from the available sources
W3-S1-F14 · 52.9:13.1:32.5:1.5
W3-S1-F14
Component mass calculator · W3-S1-F14
Calculated mass conversions; editing inputs creates a research scenario.
| Component | MW (g/mol) | Reported molar ratio | mg | % |
|---|---|---|---|---|
| W3 | — | — | ||
| Cholesterol | — | — | ||
| DSPC | — | — | ||
| DMG-PEG2000 | — | — |
Not established from the available sources
W3-S1-F15 · 70.8:16.6:11.1:1.5
W3-S1-F15
Component mass calculator · W3-S1-F15
Calculated mass conversions; editing inputs creates a research scenario.
| Component | MW (g/mol) | Reported molar ratio | mg | % |
|---|---|---|---|---|
| W3 | — | — | ||
| Cholesterol | — | — | ||
| DSPC | — | — | ||
| DMG-PEG2000 | — | — |
Not established from the available sources
W3-S1-F16 · 53.7:26.9:17.9:1.5
W3-S1-F16
Component mass calculator · W3-S1-F16
Calculated mass conversions; editing inputs creates a research scenario.
| Component | MW (g/mol) | Reported molar ratio | mg | % |
|---|---|---|---|---|
| W3 | — | — | ||
| Cholesterol | — | — | ||
| DSPC | — | — | ||
| DMG-PEG2000 | — | — |
Not established from the available sources
Cell performance
Partial evidence; formulation correspondence unresolved
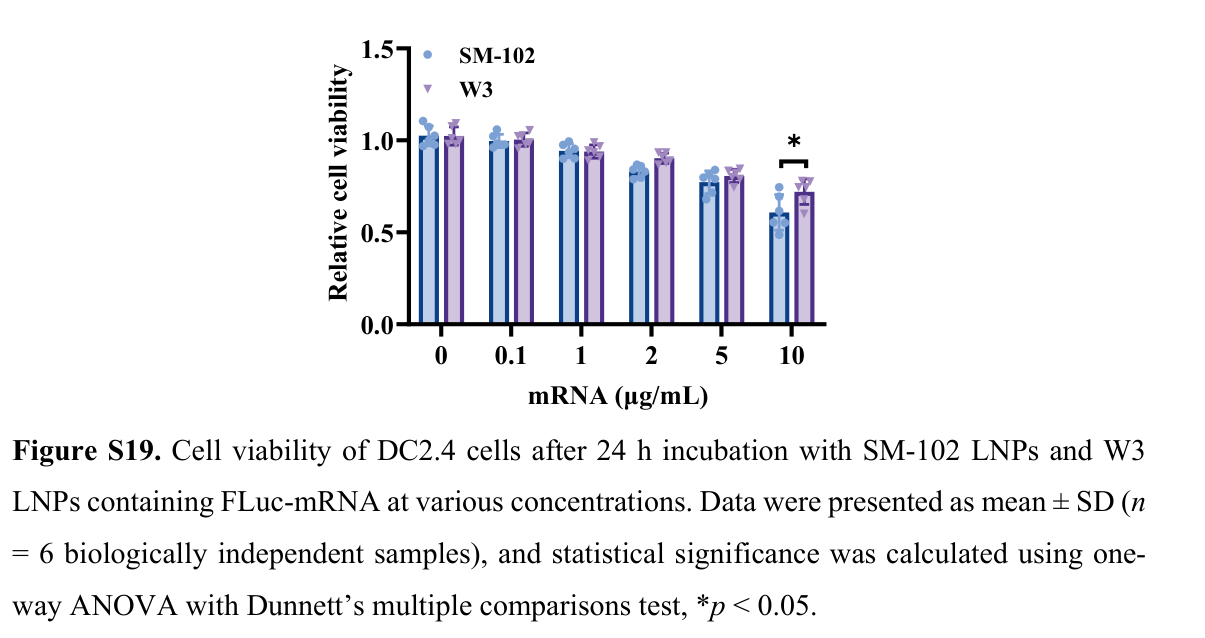
SI Fig. S19: DC2.4 cells were incubated for 24 h with FLuc-mRNA LNPs at 0, 0.1, 1, 2, 5 and 10 µg/mL mRNA. W3 and SM-102 formulations were compared; n=6 biologically independent samples, mean ± SD, one-way ANOVA with Dunnett multiple comparisons. The plotted comparison at 10 µg/mL is marked p<0.05. Exact viability percentages are not transcribed from bar heights. Exact formulation and exposure volume are unresolved.
Cell experiment protocol
Partial evidence; formulation correspondence unresolved
Song et al., ACS Nano (2026) · SI Fig. S19, p13
Lipid stocks
The supplied SI does not specify the LNP stock solvent/concentration, aqueous buffer/pH/RNA input concentration, mixing equipment/flow ratio or storage conditions for this experiment. Main-text methods were unavailable. CDCl3 in the NMR section is an analytical solvent and is not used as a formulation solvent.
RNA aqueous phase
The supplied SI does not specify the LNP stock solvent/concentration, aqueous buffer/pH/RNA input concentration, mixing equipment/flow ratio or storage conditions for this experiment. Main-text methods were unavailable. CDCl3 in the NMR section is an analytical solvent and is not used as a formulation solvent.
Mixing and dilution
The supplied SI does not specify the LNP stock solvent/concentration, aqueous buffer/pH/RNA input concentration, mixing equipment/flow ratio or storage conditions for this experiment. Main-text methods were unavailable. CDCl3 in the NMR section is an analytical solvent and is not used as a formulation solvent.
Final treatment / administration
Partial evidence; formulation correspondence unresolved
Incubate DC2.4 cells with FLuc-mRNA LNPs at the reported mRNA concentrations for 24 h and evaluate relative viability against the study controls (SI Fig. S19). Seeding, medium, assay reagent and treatment volume remain unavailable.
Storage and use
The supplied SI does not specify the LNP stock solvent/concentration, aqueous buffer/pH/RNA input concentration, mixing equipment/flow ratio or storage conditions for this experiment. Main-text methods were unavailable. CDCl3 in the NMR section is an analytical solvent and is not used as a formulation solvent.
- Incubate DC2.4 cells with FLuc-mRNA LNPs at the reported mRNA concentrations for 24 h and evaluate relative viability against the study controls (SI Fig. S19). Seeding, medium, assay reagent and treatment volume remain unavailable.
Animal performance
Partial evidence; formulation correspondence unresolved
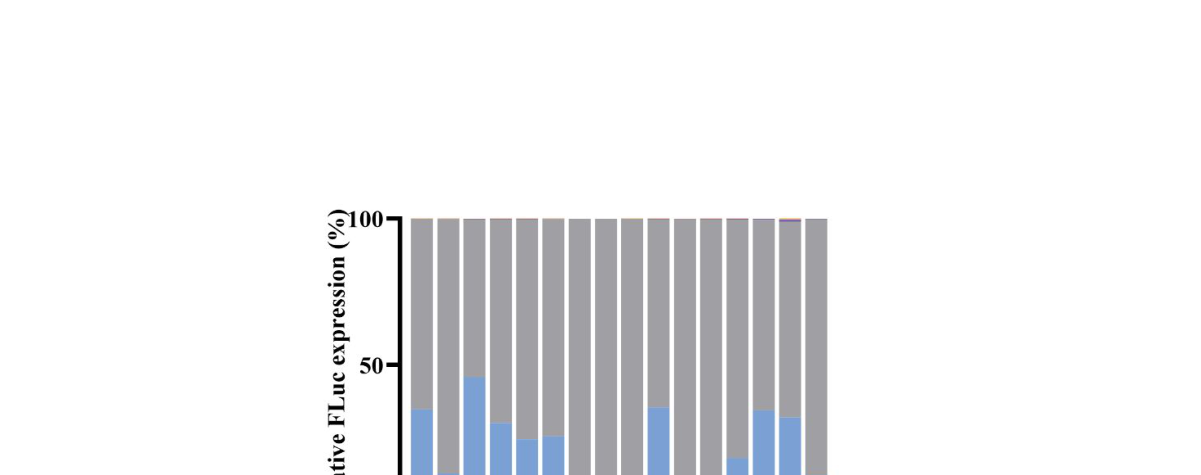
SI Fig. S25 compares the organ fractions of FLuc expression for screening formulations 1–16; exact fractions, animal strain/sex, dose and sampling time are not fully available from its caption. These are relative expression fractions, not absolute organ delivery.
Song et al., ACS Nano (2026) · SI Fig. S25, p16; Fig. S26e, pp16–17
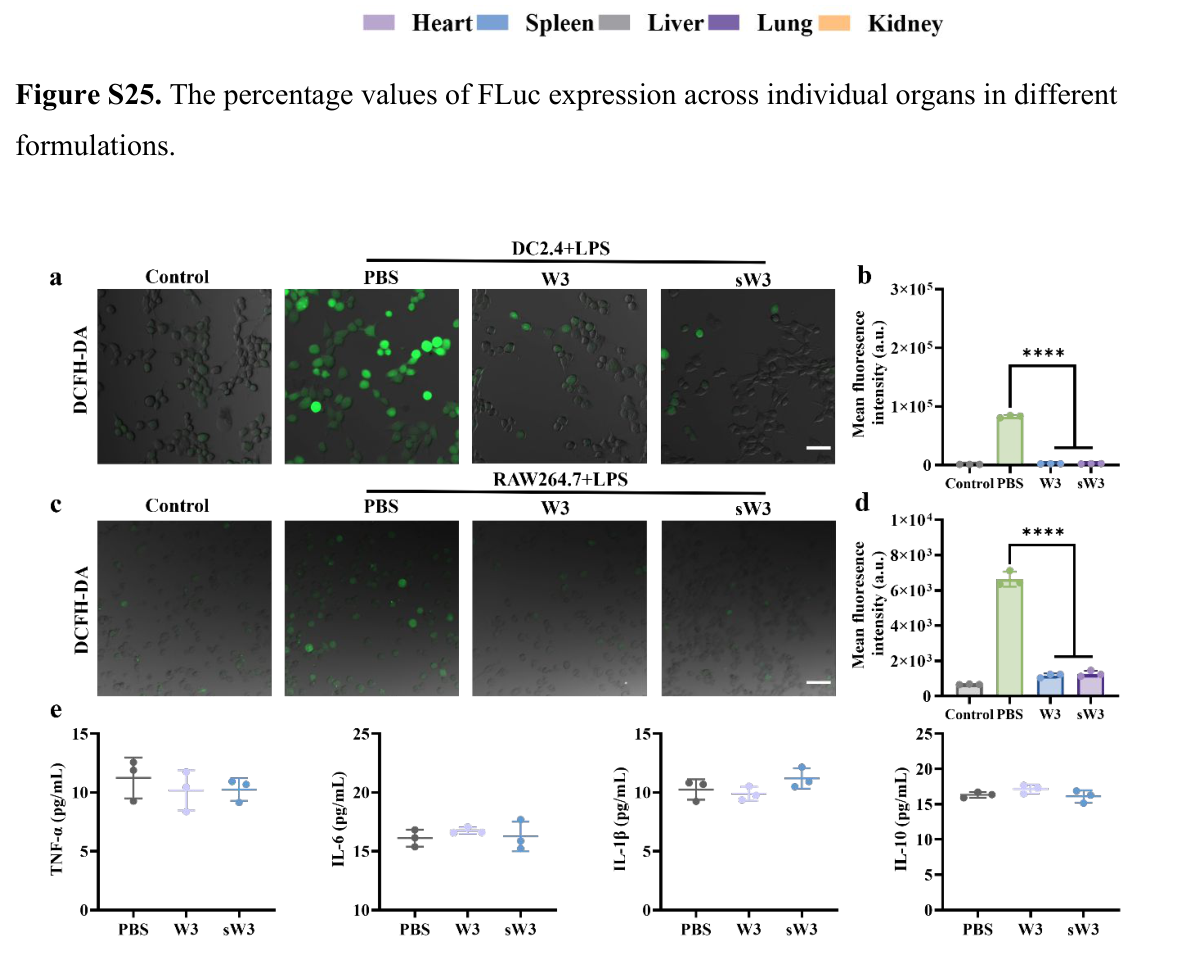
SI Fig. S26e measures serum cytokines 6 h after intravenous administration (n=3 biologically independent samples, mean ± SD). The available caption does not establish an sW3-versus-W3 cytokine advantage. Broad or clinical safety is not claimed.
Song et al., ACS Nano (2026) · SI Fig. S25, p16; Fig. S26e, pp16–17
Song et al., ACS Nano (2026) · SI Fig. S25, p16; Fig. S26e, pp16–17
Animal experiment protocol
Partial evidence; formulation correspondence unresolved
Song et al., ACS Nano (2026) · SI Fig. S25, p16; Fig. S26e, pp16–17
Lipid stocks
The supplied SI does not specify the LNP stock solvent/concentration, aqueous buffer/pH/RNA input concentration, mixing equipment/flow ratio or storage conditions for this experiment. Main-text methods were unavailable. CDCl3 in the NMR section is an analytical solvent and is not used as a formulation solvent.
RNA aqueous phase
The supplied SI does not specify the LNP stock solvent/concentration, aqueous buffer/pH/RNA input concentration, mixing equipment/flow ratio or storage conditions for this experiment. Main-text methods were unavailable. CDCl3 in the NMR section is an analytical solvent and is not used as a formulation solvent.
Mixing and dilution
The supplied SI does not specify the LNP stock solvent/concentration, aqueous buffer/pH/RNA input concentration, mixing equipment/flow ratio or storage conditions for this experiment. Main-text methods were unavailable. CDCl3 in the NMR section is an analytical solvent and is not used as a formulation solvent.
Final treatment / administration
Partial evidence; formulation correspondence unresolved
SI Fig. S25 compares the organ fractions of FLuc expression for screening formulations 1–16; exact fractions, animal strain/sex, dose and sampling time are not fully available from its caption. These are relative expression fractions, not absolute organ delivery.
Storage and use
The supplied SI does not specify the LNP stock solvent/concentration, aqueous buffer/pH/RNA input concentration, mixing equipment/flow ratio or storage conditions for this experiment. Main-text methods were unavailable. CDCl3 in the NMR section is an analytical solvent and is not used as a formulation solvent.
- SI Fig. S25 compares the organ fractions of FLuc expression for screening formulations 1–16; exact fractions, animal strain/sex, dose and sampling time are not fully available from its caption. These are relative expression fractions, not absolute organ delivery.
Song et al., ACS Nano (2026) · SI Fig. S25, p16; Fig. S26e, pp16–17
Lipid stocks
The supplied SI does not specify the LNP stock solvent/concentration, aqueous buffer/pH/RNA input concentration, mixing equipment/flow ratio or storage conditions for this experiment. Main-text methods were unavailable. CDCl3 in the NMR section is an analytical solvent and is not used as a formulation solvent.
RNA aqueous phase
The supplied SI does not specify the LNP stock solvent/concentration, aqueous buffer/pH/RNA input concentration, mixing equipment/flow ratio or storage conditions for this experiment. Main-text methods were unavailable. CDCl3 in the NMR section is an analytical solvent and is not used as a formulation solvent.
Mixing and dilution
The supplied SI does not specify the LNP stock solvent/concentration, aqueous buffer/pH/RNA input concentration, mixing equipment/flow ratio or storage conditions for this experiment. Main-text methods were unavailable. CDCl3 in the NMR section is an analytical solvent and is not used as a formulation solvent.
Final treatment / administration
Partial evidence; formulation correspondence unresolved
SI Fig. S26e measures serum cytokines 6 h after intravenous administration (n=3 biologically independent samples, mean ± SD). The available caption does not establish an sW3-versus-W3 cytokine advantage. Broad or clinical safety is not claimed.
Storage and use
The supplied SI does not specify the LNP stock solvent/concentration, aqueous buffer/pH/RNA input concentration, mixing equipment/flow ratio or storage conditions for this experiment. Main-text methods were unavailable. CDCl3 in the NMR section is an analytical solvent and is not used as a formulation solvent.
- SI Fig. S26e measures serum cytokines 6 h after intravenous administration (n=3 biologically independent samples, mean ± SD). The available caption does not establish an sW3-versus-W3 cytokine advantage. Broad or clinical safety is not claimed.
Song et al., ACS Nano (2026) · SI Fig. S25, p16; Fig. S26e, pp16–17
Original literature performance figures
Original figures from Song et al., ACS Nano (2026), DOI 10.1021/acsnano.6c17082, supplied Supporting Information. No curves were redrawn. Separate experiment IDs preserve unresolved formulation mapping.
Main article PDF is still required for full pKa, N/P, formulation-to-performance mapping and complete preparation/cell/animal methods. Supporting Information has already been received.